
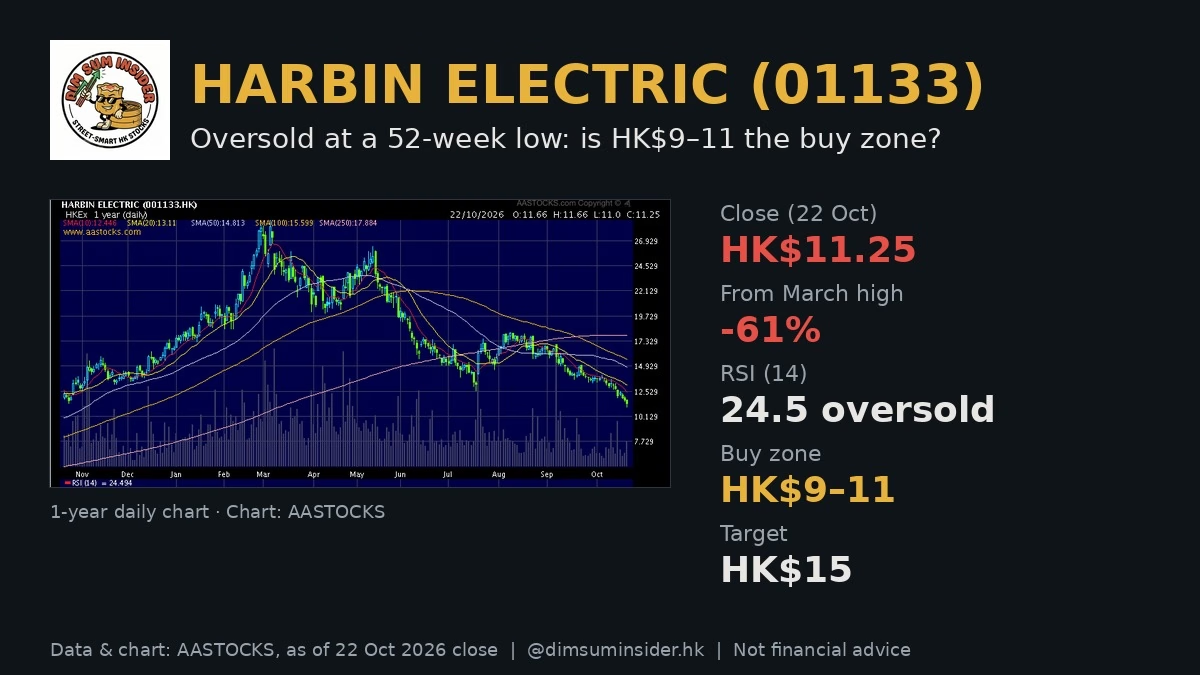
Seven straight months of selling have taken Harbin Electric (01133) from a record HK$28.88 in March to HK$11.25 at Thursday’s close, a new 52-week low and a drop of about 61%. This Harbin Electric 01133 stock analysis asks the alpha question: profits are still growing at double-digit pace, so has the sell-off gone too far, and is the market handing out a high-yield power-equipment name at a single-digit P/E?
Market commentary notes argue yes: after the valuation reset, HEC looks attractive, with an accumulation zone of HK$9–11 and a target of HK$15. Thursday’s slide below the HK$11.63 close cited in that commentary means the stock is now knocking on the door of that zone.
The news in brief
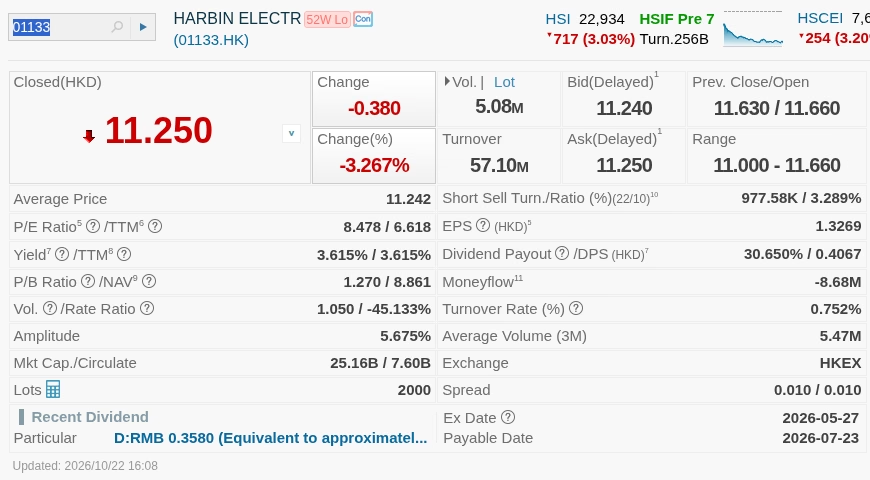
- Record high to 52-week low. HEC hit a record HK$28.88 in March and then fell for seven straight months to HK$11.63 on 21 Oct. On 22 Oct it lost another 3.3% to HK$11.25, a new 52-week low (AASTOCKS).
- Weak tape. The Hang Seng Index opened higher and closed lower on 21 Oct, dragged by weak US tech, and sentiment in Hong Kong remains fragile.
- Earnings still climbing. Market commentary notes that HEC turned around from 2022, with net profit rising sharply each year since on a low base. For 1H2026, revenue rose 10.3% to about RMB24.8bn, net profit jumped 63.5% to about RMB1.718bn, and gross margin improved 2.95 points to about 15%.
- Why the stock fell anyway: the market expects coal-power equipment orders to peak and roll over as China sharply cuts new coal-power approvals (“good news fully priced”), peer Dongfang Electric (01072) had targets cut, and brokers trimmed HEC targets from about HK$32 to about HK$30 while lowering EPS forecasts.
- Valuation was stretched at the top. At the March high, HEC traded on roughly 22x trailing earnings. Today AASTOCKS shows a P/E of 8.5x and a TTM P/E of 6.6x.
- Order book is deep. Total backlog is estimated at over RMB100bn. 1H2026 new orders were RMB36.04bn (+1.35%), with new-type power equipment orders of RMB27.1bn (+41.19%), per company interim data cited in the commentary.
- The call: forward yield of about 5.2%, accumulate at HK$9–11, target HK$15.
Fundamentals: profits up, stock down
This is the classic “results beat, stock sinks” setup. The 1H numbers are good: double-digit sales growth, profit up nearly two-thirds and a near three-point margin expansion. The problem is not the last six months, it is the next three years. China has sharply cut new coal-power approvals, and coal-fired units have been a key driver of the order boom across HEC and Dongfang Electric. When investors think orders have peaked, they stop paying for growth even while reported earnings keep rising.
The bull counter is the order book. A backlog estimated at more than RMB100bn, against roughly RMB50bn of annualised revenue on our maths from the 1H run-rate, gives about two years of work already in hand. New orders held steady at RMB36.04bn in the half, and the new-type power equipment category grew 41%, which suggests the mix is shifting rather than collapsing.
Management has also been selective. Market commentary notes that HEC optimised its order strategy, delivering or releasing low-margin legacy contracts, while higher-margin orders signed in recent years should support relatively high growth for the next three years. That is consistent with the 2.95-point gross-margin gain.
Why the de-rating happened
- Coal-power peak fears. Fewer new approvals means fewer future boiler and turbine orders.
- Sector read-across. Target cuts at Dongfang Electric (01072) hit the whole group.
- Starting valuation. A run to HK$28.88 at about 22x trailing P/E left no room for disappointment. Broker targets slipped from about HK$32 to about HK$30, and the stock fell anyway.
Harbin Electric 01133 stock analysis: valuation and key numbers
| Metric | Harbin Electric (01133) |
|---|---|
| Last price (22 Oct close) | HK$11.25 |
| Day change | -HK$0.38 (-3.27%) |
| Prev close / open | HK$11.63 / HK$11.66 |
| Day range | HK$11.00 – 11.66 |
| 52-week range | HK$11.33 – 28.88 (new 52-week low) |
| Market cap (H-share circulating) | HK$25.16B (HK$7.60B) |
| P/E (EPS 1.3269) | 8.48x |
| TTM P/E | 6.62x |
| P/B (NAV/share 8.861) | 1.27x |
| Dividend yield / DPS / payout | 3.62% / 0.4067 / 30.65% |
| SMA 10 / 20 / 50 | 12.446 / 13.110 / 14.813 |
| SMA 100 / 250 | 15.599 / 17.884 |
| RSI 10 / 14 / 20 | 20.30 / 24.49 / 29.49 (oversold) |
| MACD (12,26) / signal / divergence | -0.850 / -0.719 / -0.13 |
| Volume / turnover | 5.08M / HK$57.10M |
| Short selling ratio (half-day) | 3.29% |
What the numbers tell us (our analysis):
- Single-digit P/E on growing profits. A TTM P/E of 6.6x below the 8.5x headline P/E means trailing earnings are already running above base-year EPS: the 1H profit jump is in the numbers. Market commentary estimates the P/E falls to about 5.8x on this year’s earnings if full-year profit grows around 50%.
- Yield is the floor. The trailing yield is 3.6% on a ~30% payout. Market commentary notes that if the payout is maintained, the forward yield is about 5.2% at HK$11.63; at HK$11.25 that edges higher on our maths.
- Near book value. At 1.27x NAV of HK$8.86, the bottom of the HK$9–11 buy zone is close to book.
- HK$15 is upside, not a moonshot. The target is about 33% above Thursday’s close and sits roughly at the 50- to 100-day moving averages, a sensible mean-reversion level.
- Shorts are not the story. A 3.3% short ratio says this is long holders exiting, not a crowded short.
Technical analysis: oversold, but still falling
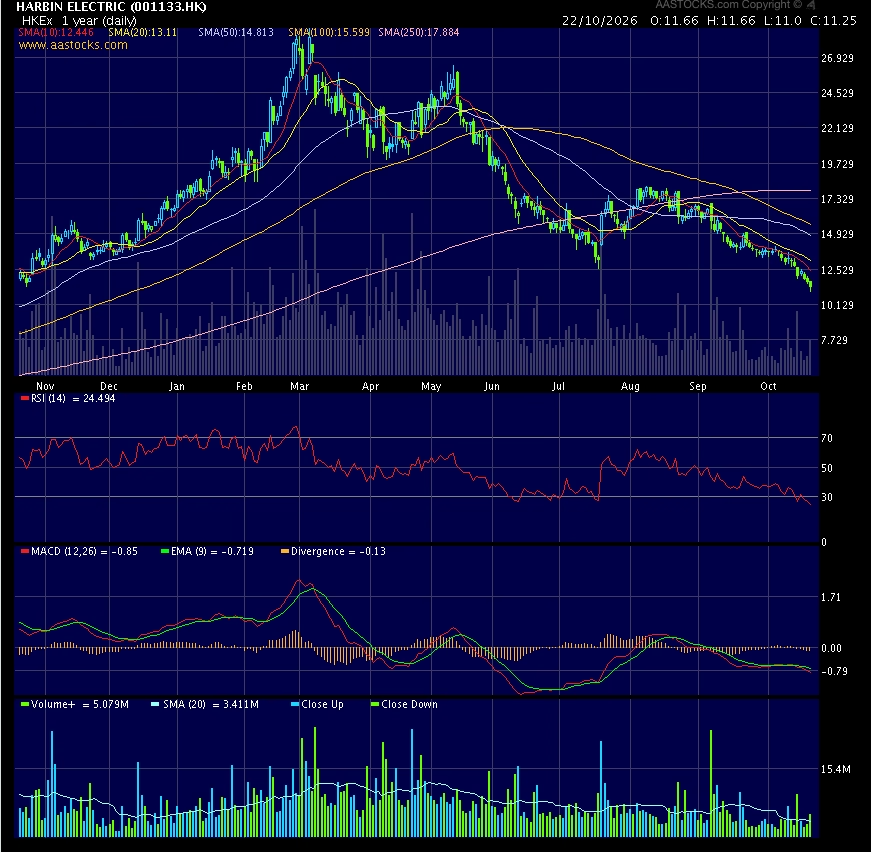
The one-year chart is a round trip: a steep rally into the March record high, then a seven-month staircase down. Price is below all five listed AASTOCKS SMAs (10, 20, 50, 100 and 250 days), stacked in bearish order from 12.4 up to 17.9. That is a textbook downtrend.
Momentum is stretched to the downside:
- Deeply oversold. RSI(10) at 20.3 and RSI(14) at 24.5 are well below 30.
- MACD not turning yet. MACD at -0.85 is below its -0.719 signal line, a -0.13 divergence. No bullish cross yet.
- Fresh low on a down day. The intraday low of HK$11.00 undercut the prior 52-week low of HK$11.33. Bulls need that to be the flush.
Levels: support at HK$11.00 (Thursday’s low), then HK$9–11 (the commentary’s accumulation zone, near book value). First resistance is the 10-day SMA at HK$12.45, then the 20-day at HK$13.11 and the HK$14.8–15.6 band of the 50- and 100-day lines, which lines up with the HK$15 target.
Bull case vs bear case
Bull case
- 1H net profit +63.5% and gross margin +2.95 points: earnings momentum is real.
- Order book estimated at over RMB100bn, with high-margin orders seen supporting growth for three years.
- Forward yield about 5.2% if the ~30% payout holds, at a P/E of 6.6x TTM.
- RSI in the 20s and a 61% drawdown: a lot of bad news is already in the price.
Bear case
- China’s sharp cut in coal-power approvals could make 2026 the order peak.
- Broker EPS cuts and Dongfang Electric target cuts show the sector narrative has turned.
- Price is below every moving average and MACD has not crossed up: no confirmation of a bottom.
- A weak Hang Seng tape driven by US tech can keep pressure on any rebound.
Levels to watch
- HK$11.00 on a closing basis. Thursday’s intraday low and the top of the buy zone.
- HK$9–11 accumulation zone. Market commentary’s staged buy range, near book value.
- HK$12.45 / 13.11. Reclaiming the 10- and 20-day SMAs would be the first sign the slide is over.
- HK$15 target. Coincides with the 50- and 100-day SMA band.
- New-order data. Watch whether new-type power equipment orders keep offsetting coal-power weakness.
The DimSumInsider take
Harbin Electric is a good-results, bad-chart stock. Profits are growing fast, the backlog is deep and the yield case is building, but the market is pricing a coal-power order cliff. At 6.6x trailing earnings, 1.27x book and a forward yield around 5%, a lot of that fear is already in the price. Our approach: the HK$9–11 zone is where you scale in, not chase, and you want the 10-day line back before adding size. The alpha is collecting yield while the market argues about 2027 orders.
FAQ
Why has Harbin Electric (01133) fallen so much?
The market expects coal-power equipment orders to peak as China sharply cuts new coal-power approvals, peer Dongfang Electric had targets cut, and brokers lowered HEC targets and EPS forecasts. The stock fell from a HK$28.88 record in March to HK$11.25 on 22 Oct 2026 (AASTOCKS).
How did Harbin Electric do in 1H2026?
Revenue rose 10.3% to about RMB24.8bn, net profit rose 63.5% to about RMB1.718bn and gross margin improved 2.95 points to about 15%.
What is the target price for 01133?
Market commentary sets a HK$15 target with an accumulation zone of HK$9–11.
What is Harbin Electric’s dividend yield?
AASTOCKS shows a trailing yield of 3.62% on a 30.65% payout. Market commentary estimates a forward yield of about 5.2% if the payout is maintained.
What are the key technical levels?
Support at HK$11.00 and the HK$9–11 zone; resistance at HK$12.45 (10-day SMA), HK$13.11 (20-day) and HK$14.8–15.6 (50- and 100-day). RSI(14) is 24.5, oversold.
Disclaimer: For information only. Based on public market commentary notes, company interim data and AASTOCKS data as of 22 Oct 2026 close; data may be delayed. DimSumInsider may hold positions not stated here. Consult a licensed financial adviser. This is not financial advice. Do your own research.
Leave a Reply