Tag: Dividend stocks

  • Chow Sang Sang (00116): High Yield, Low Valuation as Gold Retakes US$4,000

    Chow Sang Sang (00116): High Yield, Low Valuation as Gold Retakes US$4,000

    Chow Sang Sang (00116), listed as CHOW SANG SANG on AASTOCKS, jumped 3.76% to HK$13.24 on Thursday 5 Nov as gold climbed back to US$4,000/oz and Hong Kong stocks rallied. This Chow Sang Sang 00116 stock analysis asks whether a jeweller earning record profits, still growing same-store sales and trading near 5x earnings with a 7.6% yield is a value opportunity or a gold-price trap.

    Market commentary notes call it high yield, low valuation and suggest accumulating at current prices with a HK$16 target. We think the risk-reward is attractive, with the gold price as the swing factor.
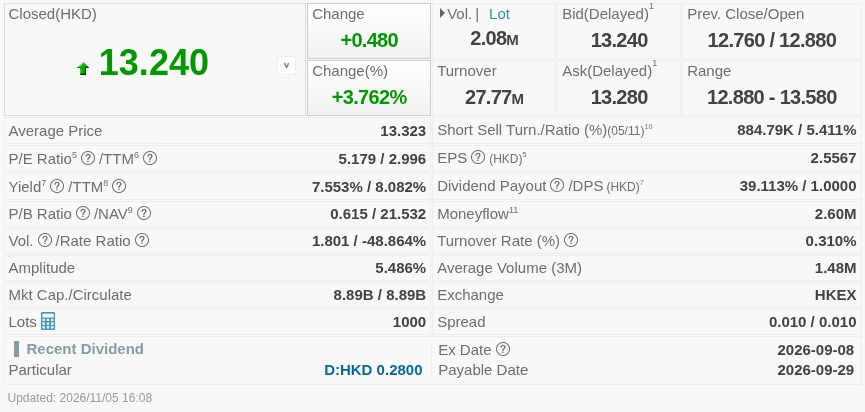
    Chow Sang Sang (00116) detailed quote on AASTOCKS, 5 Nov 2026 16:08 HKT
    Source: AASTOCKS, as of 5 Nov 2026 16:08 HKT

    Key takeaways

    • Record first half. H1 2026 revenue HK$12.878bn (+16.7%) and net profit HK$2.153bn (+138.7%), helped by higher gold prices. The first interim dividend rose 33.3% to 28 cents.
    • Sales still growing in Q3. Even with gold well off its early-year level, Q3 retail sales rose 3%. Hong Kong and Macau same-store sales (SSS) rose 7%, mainland SSS rose 4%, and Taiwan and other regions were also positive.
    • Fewer, better stores. 739 points of sale at end-September, 37 fewer than at end-June. The group is focusing on tier-2-and-above mainland cities and upgrading shops.
    • Gold is back at US$4,000. The World Gold Council (WGC) reports central banks bought a net 321 tonnes in Q3, up 42% YoY, the fastest growth since end-2024.
    • Cheap on AASTOCKS numbers. P/E 5.18x (TTM 3.00x), P/B 0.62x against NAV of HK$21.53, and yield 7.55% (TTM 8.08%).
    • Commentary view. Trailing P/E under 5x, about 3x forward; trailing yield about 7.84%, forward near 10%; accumulate, target HK$16.

    Gold: a double-edged sword for jewellers

    Chow Sang Sang shares peaked at HK$16.69 in late August, then fell with gold. Investors worried that jewellers holding large gold inventories would see short-term margin pressure and could need inventory write-downs. The stock touched HK$11.93 on Monday before rebounding.

    Market commentary notes argue a gold pullback cuts both ways. Lower prices bring back shoppers who had been put off by high prices, and news reports describe more customers in jewellery shops recently. The notes also see the US midterm results, which left the Republicans without control of either chamber, as limiting further large fiscal expansion and tax cuts. That could ease US Treasury yields and the US dollar, which tends to support both stocks and gold.

    The longer-term gold story remains supported by central bank buying: 321 tonnes net in Q3 according to the WGC, +42% YoY.

    Chow Sang Sang H1 2026 results and Q3 update

    ItemH1 2026Change
    RevenueHK$12.878bn+16.7% YoY
    Net profitHK$2.153bn+138.7% YoY
    First interim dividendHK$0.28+33.3% YoY
    Source: company results as reported in market commentary notes. AASTOCKS lists the HK$0.28 dividend with ex-date 2026-09-08, payable 2026-09-29.
    Q3 2026 operating metricChange / figure
    Retail sales value+3%
    Hong Kong & Macau same-store sales+7%
    Mainland China same-store sales+4%
    Taiwan and other regionsPositive growth
    Points of sale (end-Sep)739 (−37 vs end-June)
    Source: company Q3 operational update as reported in market commentary notes.

    Our read: positive same-store sales in every region, after a quarter in which gold was volatile, suggest demand is holding up. Closing 37 stores while targeting larger cities should support productivity per store.

    Chow Sang Sang 00116 stock analysis: valuation

    MetricChow Sang Sang (00116)
    Last price (2026/11/05 close)HK$13.240
    Day change+HK$0.480 (+3.762%)
    Prev close / openHK$12.760 / HK$12.880
    Day rangeHK$12.880 – 13.580
    52-week rangeHK$9.480 – 16.690
    Market capHK$8.89B
    P/E / TTM P/E5.179x / 2.996x (EPS HK$2.5567)
    P/B (NAV HK$21.532)0.615x
    Dividend yield / TTM7.553% / 8.082% (DPS HK$1.00)
    Volume / turnover2.08M / HK$27.77M
    Data: AASTOCKS, updated 2026/11/05 16:08 HKT, market Closed; quotes delayed.
    Market commentary notesFigure
    Reference closeHK$12.76 (2026/11/04, +3.1%)
    Earlier callRecommended at HK$10.76 in June, target HK$13.40 (reached)
    Trailing P/EUnder 5x, below peers
    Forward P/EAbout 3x
    Trailing / forward yield~7.84% / near 10%
    Full-year profit outlookHigh double-digit growth
    Strategy / targetAccumulate at current price / HK$16 (~20.8% above HK$13.24)
    Source: market commentary notes (forward-looking views and estimates, not AASTOCKS data). Commentary figures were based on the HK$12.76 close; today’s AASTOCKS close is HK$13.24.

    What the numbers tell us (our analysis):

    • Below book value. At 0.62x P/B the market prices the company well under its HK$21.53 NAV, unusual for a profitable, dividend-paying retailer.
    • Income support. A 7.55% yield on HK$1.00 DPS pays holders to wait. AASTOCKS shows a dividend payout of about 39%, leaving room for the payout to grow.
    • Room to the high. At HK$13.24 the stock is about 21% below its 52-week high of HK$16.69 and 40% above the HK$9.48 low.

    Technical analysis: back above all key averages
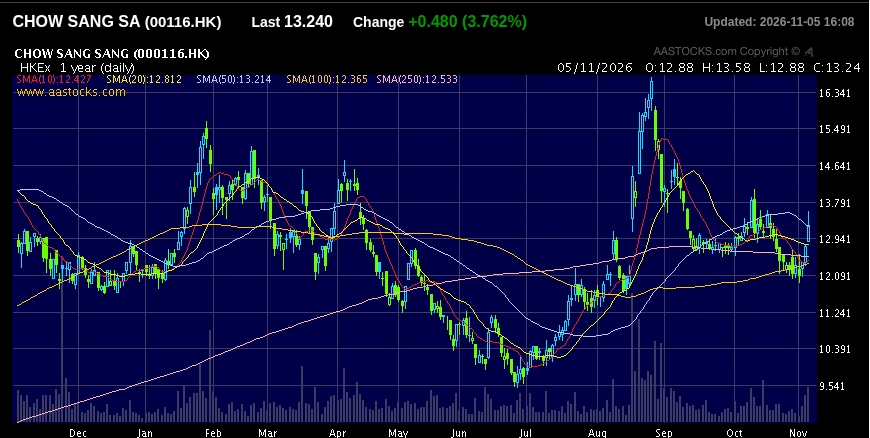
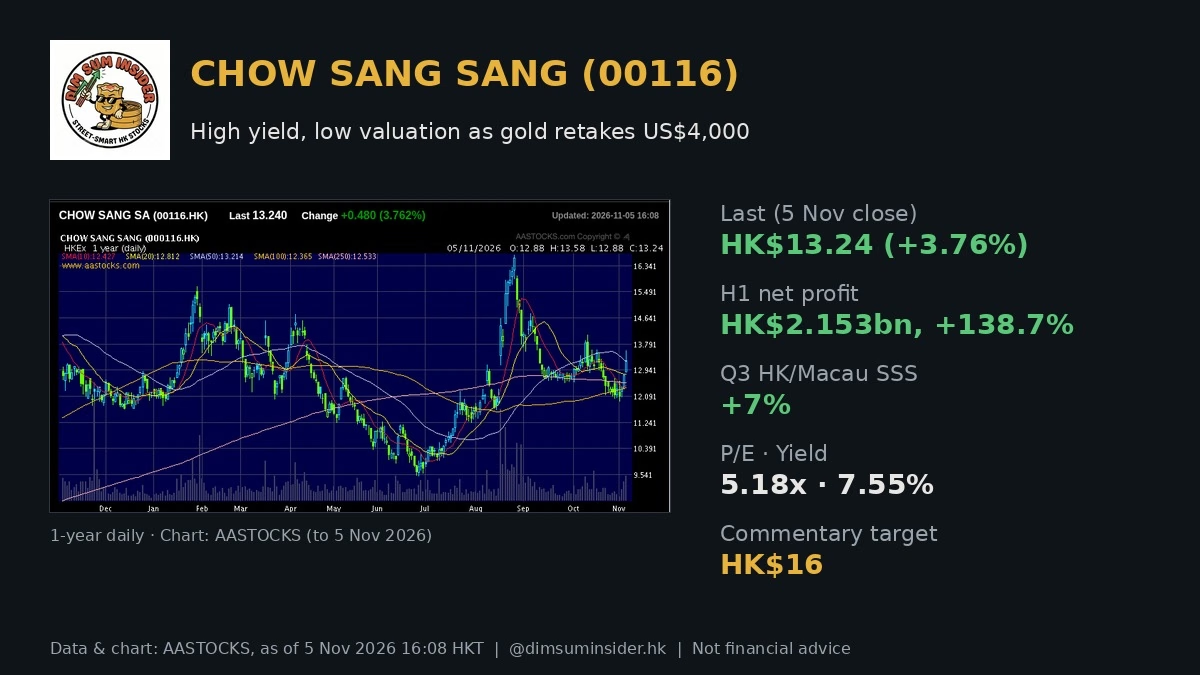
    Chow Sang Sang (00116) one-year daily chart on AASTOCKS
    Source: AASTOCKS, as of 5 Nov 2026 16:08 HKT; 1-year daily chart

    The AASTOCKS one-year daily chart shows a spike to about HK$15.5 in February, a slide to the HK$9.48 low in early July, then a sharp rally to HK$16.69 in late August. The stock then pulled back and spent October drifting around HK$12–13 before Thursday’s jump.

    • Moving averages. The close of 13.24 is above SMA10 12.427, SMA100 12.365, SMA250 12.533, SMA20 12.812 and, just, SMA50 13.214.
    • Momentum. RSI(14) is 57.2, firm but not overbought. Thursday’s intraday high was HK$13.58.
    • Support. HK$12.81 (SMA20), then HK$12.37–12.53 (SMA100/SMA250), then HK$11.93 (Monday’s low).
    • Resistance. HK$13.58 (day high), then around HK$14.6 (September rebound zone), then HK$16.0 (commentary target) and HK$16.69 (52-week high).

    Risks

    • Gold price. A fresh fall in gold could hit margins and force inventory write-downs; the first-half profit surge was partly gold-driven.
    • Tough comparisons. A +138.7% profit jump sets a high base for next year.
    • Consumer demand. Mainland spending and Hong Kong tourist flows can turn quickly.
    • Store network. Fewer stores (−37 in Q3) must be offset by higher sales per store.
    • Just above SMA50. A close back below HK$13.21 would weaken the breakout.
    • Estimates can change. Forward P/E, yield and targets are views, not guarantees.

    The DimSumInsider take

    Chow Sang Sang combines record profits, positive same-store sales across regions and a sub-book valuation with a 7.6% yield. Gold is the key variable, but the stock already priced in much of the pullback. We agree with the market commentary notes’ stance: accumulating at current prices looks reasonable, with HK$16 as the target. We would want the price to hold above SMA20 (HK$12.81) and would reassess below the HK$11.93 low.

    FAQ

    What were Chow Sang Sang’s H1 2026 results?

    Revenue rose 16.7% to HK$12.878bn and net profit rose 138.7% to HK$2.153bn. The first interim dividend rose 33.3% to 28 cents.

    How did Chow Sang Sang trade in Q3 2026?

    Retail sales rose 3%. Hong Kong and Macau same-store sales rose 7%, mainland same-store sales rose 4%, and Taiwan and other regions also grew. There were 739 points of sale at end-September, 37 fewer than at end-June.

    How does the gold price affect Chow Sang Sang?

    Higher gold lifts revenue and inventory gains but can deter buyers. A falling price can squeeze margins and trigger write-downs, but it also brings price-sensitive shoppers back.

    What is Chow Sang Sang’s valuation?

    According to AASTOCKS as of the 2026/11/05 close: HK$13.24, P/E 5.18x (TTM 3.00x), P/B 0.62x, yield 7.55% (TTM 8.08%) and market cap HK$8.89B. Market commentary notes put the forward P/E at about 3x and the forward yield near 10%.

    What levels matter for 00116?

    Support is at HK$12.81, then HK$12.37–12.53, then HK$11.93. Resistance is at HK$13.58, then about HK$14.6, then HK$16.0 and HK$16.69.


    Disclaimer: For information only. Based on public market commentary notes, company results and operating updates as reported, World Gold Council data, and AASTOCKS data as of 2026/11/05 16:08 HKT (market Closed); data may be delayed. Forward P/E, yields and targets are forward-looking estimates. DimSumInsider may hold positions not stated here. Consult a licensed financial adviser. This is not financial advice. Do your own research.
  • 361 Degrees (01361): Retail Outruns ANTA and FILA, a Cheap Re-Rating Bet

    361 Degrees (01361): Retail Outruns ANTA and FILA, a Cheap Re-Rating Bet

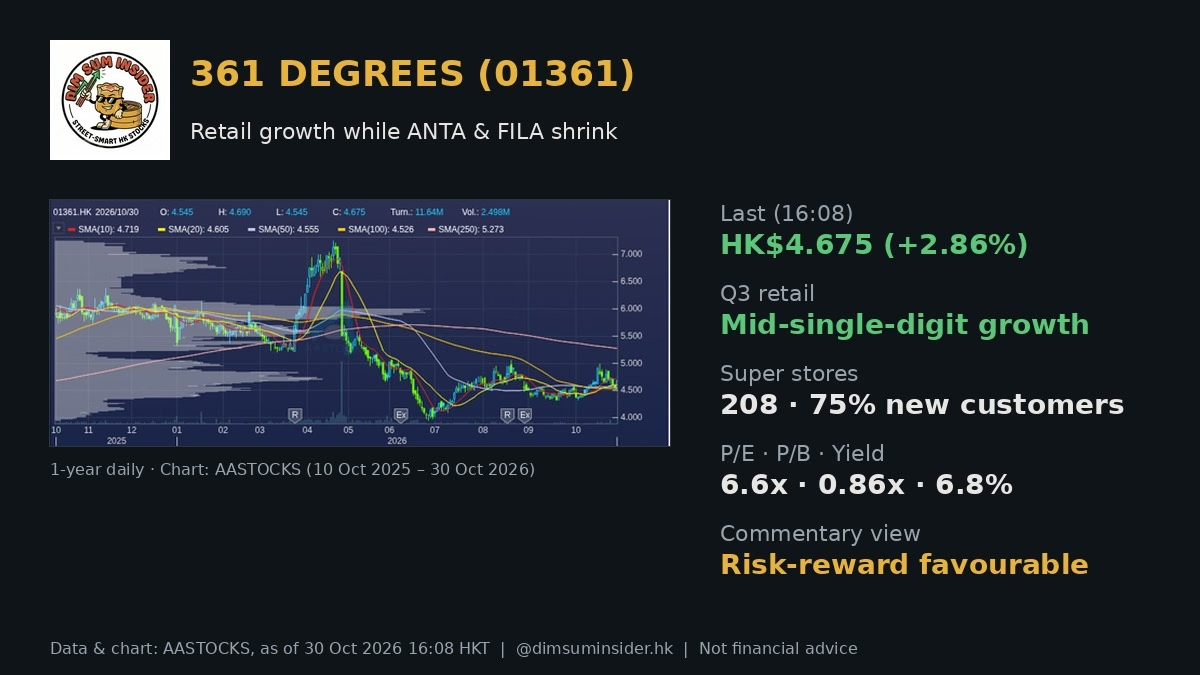
    361 Degrees (01361), listed as 361 DEGREES on AASTOCKS, closed at HK$4.675 on Friday 30 Oct, up HK$0.130 (+2.86%). This 361 Degrees 01361 stock analysis asks the alpha question. In a quarter when the big China sportswear names went backwards, 361 kept growing. At about 6.6x earnings, 0.86x book and a ~6.8% trailing yield, is that enough to earn a re-rating?

    Market commentary notes argue it is: retail is outrunning peers, the super-store rollout is pulling in genuinely new customers, and discounts are holding. Their view is that the risk-reward is favourable. The stock does not have to rally hard, but the downside looks limited. We broadly agree, with two caveats: the RMB and a high base.

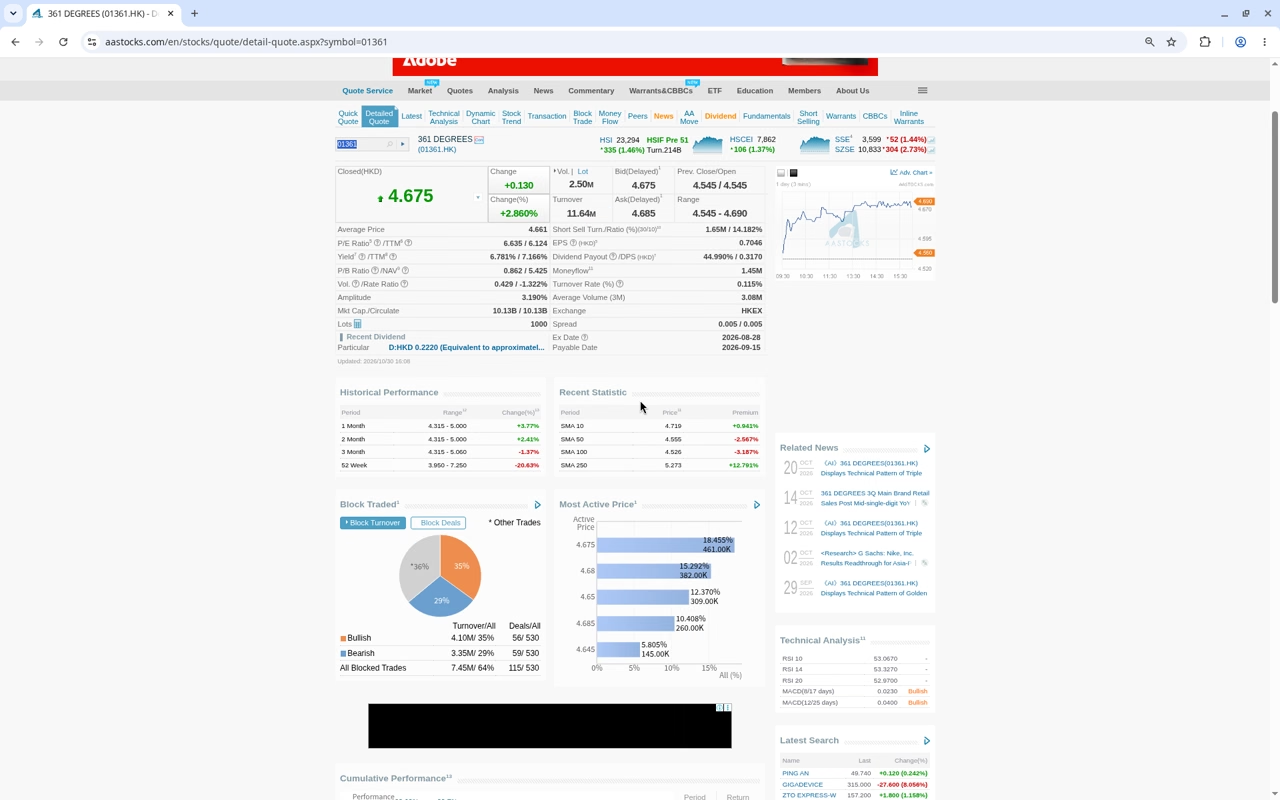
    361 Degrees (01361) detailed quote on AASTOCKS, 30 Oct 2026 16:08 HKT
    Source: AASTOCKS, as of 30 Oct 2026 16:08 HKT

    The news in brief

    • Q3 retail sales. Main-brand and kids offline retail both grew at a mid-single-digit rate. E-commerce grew at a mid-to-high single-digit rate.
    • Peers went the other way. In the same week, the ANTA brand (02020) fell by a mid-single digit and FILA fell by a low-single digit. Li Ning (02331) and Xtep (01368) were expected to report slight declines.
    • Super stores. 21 opened in Q3, for 208 on the mainland, and the full-year opening target was hit early. The share of new customers at these stores rose from about 65% to 75%, so three in every four shoppers are new to the brand.
    • Discount and inventory. The offline discount was about 30% off, a touch deeper than roughly 29% off in Q2. The inventory-to-sales ratio held at 4.5–5x.
    • Overseas. Management targets overseas at about 30% of revenue within 3–5 years. Overseas retail grew about 80% in H1, but it is expected to be only 4–5% of revenue for the full year.
    • Friday close (AASTOCKS, 30 Oct 2026 16:08 HKT). Last HK$4.675, open/prev close 4.545, day range 4.545–4.690, volume 2.50M, turnover HK$11.64M. Market Closed.

    Why the super-store number matters more than the store count

    Store openings are easy to count and easy to over-read. In a crowded market, the real risk for a sportswear brand is fighting rivals for the same customers until the only lever left is the discount. A 75% new-customer share at the super stores suggests 361 is widening its customer base, not just moving existing customers between channels. Tier-1 and tier-2 mall space is expensive, but if it brings in people who were not 361 customers before, it counts as investment rather than cost.

    The discount data backs this up. Basketball was the most competitive category in Q3 and international brands were marking down harder, yet 361’s offline discount moved only from about 29% to about 30% off, and inventory stayed at 4.5–5x sales. Commentary notes read this as a company that is not buying sales with price. The real warning would be heavy markdowns to clear stock in Q4.

    Overseas: an option, not the thesis

    The overseas story gets the market excited: a former Nike executive has joined, 361 has sponsored five straight Asian Games, and it had a booth at the Berlin Marathon. But at 4–5% of revenue, even a doubling next year adds only a few percentage points to group sales. Treat it like a call option: worth something, but don’t count on too much.

    Policy tailwind, with a lag

    At the end of September, the State Council General Office issued guidance on using sports events to boost consumption (5 areas, 17 tasks). It includes co-branded and licensed event merchandise and faster upgrades of smart wearables. July’s national fitness plan aims to lift regular exercise participation to 40% and sports venue area per person from 3.11 to 4 square metres. More venues and events should mean more shoe sales over time, but policy usually takes 18 months or more to show up in retail sales.

    361 Degrees 01361 stock analysis: valuation and key numbers

    Metric361 Degrees (01361)
    Last price (30 Oct 16:08)HK$4.675
    Day change+HK$0.130 (+2.860%)
    Prev close / openHK$4.545 / HK$4.545
    Day rangeHK$4.545 – 4.690
    52-week rangeHK$3.950 – 7.250
    Market capHK$10.13B
    P/E / TTM P/E (EPS 0.7046)6.635x / 6.124x
    P/B (NAV HK$5.425)0.862x
    Dividend yield / TTM / DPS6.781% / 7.166% / HK$0.317
    Payout44.99%
    SMA 10 / 20 / 504.719 / 4.605 / 4.555
    SMA 100 / 2504.526 / 5.273
    RSI 1453.3
    MACD (12,26) / signal / div0.042 / 0.049 / −0.007
    Volume / turnover2.50M / HK$11.64M
    Data: AASTOCKS, updated 30 Oct 2026 16:08 HKT, market Closed; quotes delayed. SMA20 and MACD(12,26,9) from the AASTOCKS daily chart.
    Commentary and forecast checkpointsFigure
    Share price when Q3 update was releasedHK$4.6 – 4.9
    Forecast P/E (consensus-style)5.46x
    Forecast P/B0.71x
    Payout (maintained)~45%
    Forecast dividend yield~8.25%
    Relative-strength screenAmong the ~5.2% of stocks classed “strong”; RS score 60
    1-month performance vs Hang Seng Index+13.7 ppt
    Commentary stanceRisk-reward favourable; no target price
    Source: figures cited in market commentary notes (forward-looking estimates); AASTOCKS for the quote table.

    What the numbers tell us (our analysis):

    • Trailing vs forward. AASTOCKS shows 6.6x P/E (TTM 6.1x) on reported earnings. The commentary’s 5.46x is a forecast, which assumes earnings keep growing. Either way, it is a single-digit multiple.
    • Yield: 6.8% now, ~8% forecast. AASTOCKS shows 6.78% (TTM 7.17%) on DPS HK$0.317 with a ~45% payout. The ~8.25% is the commentary’s forecast yield and is not an AASTOCKS figure. Even with zero earnings growth, a yield near 7% is hard to find in Hong Kong.
    • Below book. P/B 0.86x (the forecast is 0.71x) for a company whose sales are still growing while peers shrink.
    • Small cap, thin trading. A market cap of HK$10.1B and turnover of about HK$11.6M a day mean liquidity is a real constraint for larger buyers.

    Technical analysis: back above the 20-day line

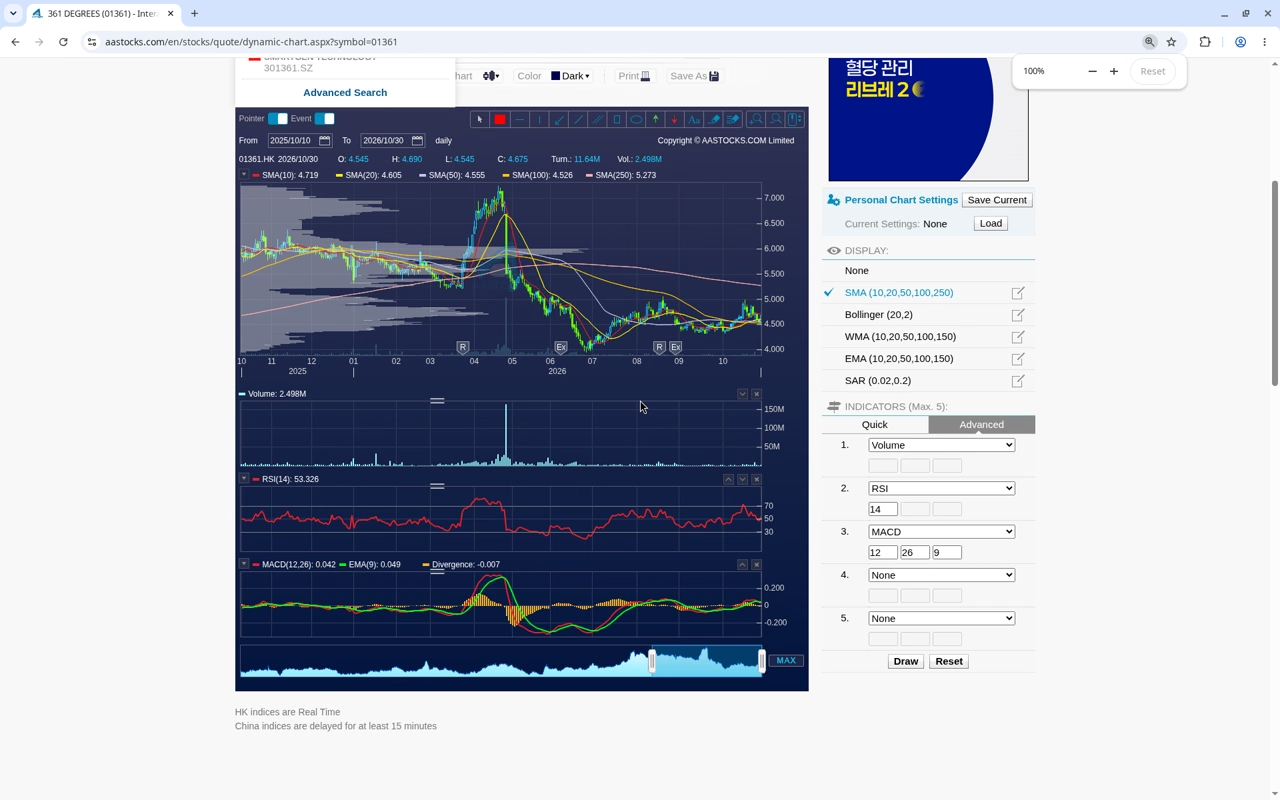
    361 Degrees (01361) one-year daily chart on AASTOCKS
    Source: AASTOCKS, as of 30 Oct 2026 16:08 HKT; 1-year daily chart

    The AASTOCKS one-year daily chart (10 Oct 2025 to 30 Oct 2026) shows a spike to about HK$7.25 in April/May, a sharp drop and a low of about HK$3.95 in late June/July, and then a base in the HK$4.3–5.0 range. Friday’s close of 4.675 sits above SMA20 4.605, SMA50 4.555 and SMA100 4.526, but just below SMA10 4.719 and well below SMA250 5.273.

    • Momentum is neutral to positive. RSI(14) is 53.3. MACD (0.042) is just under its signal line (0.049), a small negative divergence of −0.007, so the trend is flattening, not turning down.
    • Support. HK$4.53–4.61 (SMA100, SMA50 and SMA20 bunched together), then the Friday low/open at 4.545, then the HK$3.95 52-week low.
    • Resistance. HK$4.69–4.72 (day high and SMA10), then the ~HK$5.0 ceiling of the range, then HK$5.27 (SMA250). A close above the 250-day line would confirm a re-rating.

    Bull case vs bear case

    Bull case

    • Retail grew while ANTA brand, FILA, Li Ning and Xtep fell or were guided lower.
    • 75% of super-store customers are new, and the full-year store target was reached early.
    • Discounts and inventory are stable, with no price war.
    • About 6.6x P/E, 0.86x book and a 6.8% yield (TTM 7.2%), with a ~8.25% forecast in commentary.
    • A relative-strength screen ranks it among the strongest ~5% of stocks; it is up 13.7 ppt vs the HSI over a month.
    • The State Council sports-consumption guidance and the fitness plan support demand in the medium term.

    Bear case

    • RMB risk: earnings are in RMB and the shares trade in HKD, so a weaker yuan can make “cheap” an illusion.
    • High base: the main brand grew double digits in Q3 last year. If Q4 slows to low-single digits, it becomes a demand problem.
    • Consumer stocks are out of favour, and a stock can stay range-bound for a long time.
    • Overseas is still only 4–5% of revenue.
    • Low liquidity, and the price is still below SMA250.

    Levels to watch

    1. HK$3.95 (52-week low). A break would void the base.
    2. HK$4.53–4.61 (SMA100/50/20 cluster). The key trend support.
    3. HK$4.69–4.72 (day high / SMA10). The first hurdle.
    4. ~HK$5.0 (range top). A breakout would open up the re-rating.
    5. HK$5.27 (SMA250). Trend confirmation.
    6. Fundamentals. Q4 retail growth (mid-single digit vs low-single digit), discount depth, the RMB and the final dividend.

    The DimSumInsider take

    361 Degrees is a cheap, high-yield consumer name that is outgrowing its peers. Investors are also getting a small overseas option on top. The data that matters is the 75% new-customer share at super stores and a discount that barely moved in a brutal quarter. At roughly 6.6x trailing earnings and 0.86x book, with a yield near 7%, the market is pricing it as an ex-growth name. Our approach: accumulate on dips into the HK$4.53–4.61 moving-average cluster, add on a close above HK$5.0, and cut if HK$3.95 breaks. Watch the Q4 update closely, because low-single-digit growth would weaken the thesis.

    FAQ

    How did 361 Degrees’ Q3 retail sales compare with peers?

    Main-brand and kids offline retail grew at a mid-single-digit rate, and e-commerce at a mid-to-high single-digit rate. The ANTA brand fell by a mid-single digit, FILA by a low-single digit, and Li Ning and Xtep were expected to decline slightly.

    What are 361 Degrees super stores?

    They are large-format stores. 21 opened in Q3, bringing the mainland total to 208, and the full-year target was reached early. About 75% of their customers are new to the brand, up from about 65%.

    What is 361 Degrees’ dividend yield?

    AASTOCKS shows 6.781% (TTM 7.166%) on DPS of HK$0.317 with a ~45% payout, as of 30 Oct 2026 16:08 HKT. Market commentary notes forecast a yield of about 8.25%.

    What are the key 361 Degrees valuation numbers?

    At HK$4.675 (AASTOCKS, 30 Oct 2026, market Closed): P/E 6.635x (TTM 6.124x), P/B 0.862x, market cap HK$10.13B. Consensus-style forecasts put the forward P/E at about 5.46x and P/B at 0.71x.

    What levels matter for 01361?

    Support is at HK$4.53–4.61 (SMA100/50/20), then HK$4.545, then the 52-week low of HK$3.95. Resistance is at HK$4.69–4.72, then about HK$5.0, then HK$5.27 (SMA250).


    Disclaimer: For information only. Based on public market commentary notes, company operating updates as reported, and AASTOCKS data as of 30 Oct 2026 16:08 HKT (market Closed); data may be delayed. Forecast figures are estimates. DimSumInsider may hold positions not stated here. Consult a licensed financial adviser. This is not financial advice. Do your own research.
  • Ping An (02318): Core Profit Steady Behind a −93.7% Headline — Keep Holding

    Ping An (02318): Core Profit Steady Behind a −93.7% Headline — Keep Holding

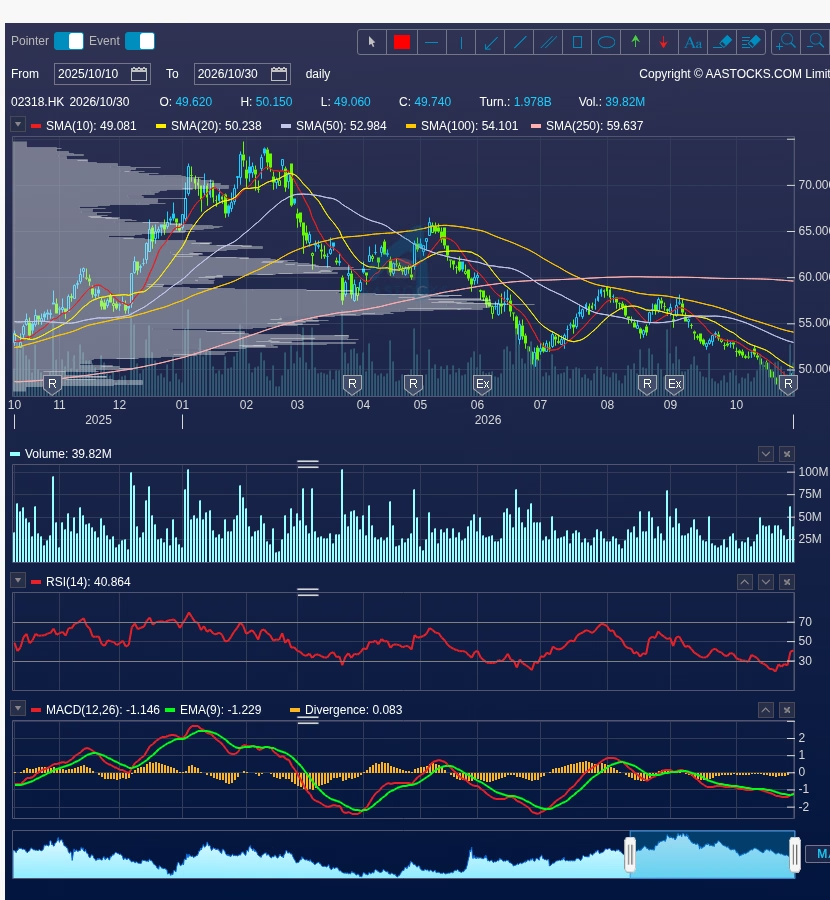
    Ping An Insurance (02318) — PING AN on AASTOCKS — closed at HK$49.740 on 30 Oct (+0.120 / +0.242%) after a +2.56% pop to HK$49.62 the session before. This Ping An 02318 stock analysis asks the alpha question: when Q3 net profit collapses 93.7% but after-tax operating profit grows 8.3%, is the headline a value trap or a mark-to-market noise opportunity at roughly 5.8x earnings and a ~6% yield?

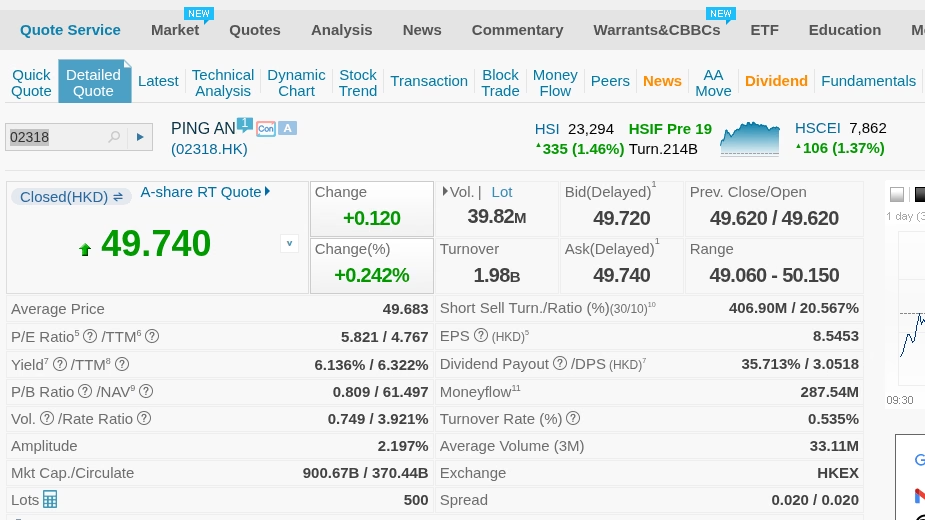
    Market commentary notes read the print as “core business steady”: the net-profit hit came from fair-value losses as China’s A-share market corrected in Q3, not from the insurance engine. Their stance is to keep holding, with a medium-term target of HK$70. Broker research from Morgan Stanley stays Overweight with a HK$85 target. Our view is close to theirs: own the operating profit and the dividend, but accept that the chart is still in a downtrend channel and needs repair.

    Ping An (02318) detailed quote on AASTOCKS, 30 Oct 2026 16:08 HKT
    Source: AASTOCKS, as of 30 Oct 2026 16:08 HKT

    The news in brief

    • Q3 headline (RMB). Revenue about 1,530億 = RMB 153.0bn (−54% YoY); net profit 40.60億 = RMB 4.06bn (−93.7% YoY), mainly from fair-value losses on equity holdings as A-shares corrected.
    • 9M (RMB). Revenue 7,281.34億 = RMB 728.13bn (−12.6%); net profit 966.45億 = RMB 96.65bn (−27.3%), versus +36.1% at the H1 stage.
    • The number that matters. Q3 after-tax operating profit about RMB 41.7bn; 9M operating profit about RMB 125.9bn, both +8.3% YoY. Strip out short-term investment swings and the core business grew.
    • Franchise. The “integrated finance + health care and elderly care” model spans life and health, P&C, pensions, banking, asset management, trust and securities. About 256m customers at end-September; 99% 12-month retention for customers holding 3+ product categories.
    • Broker view. Morgan Stanley calls Q3 operating profit resilient, attributes a weaker single-quarter new business value (VNB) print mainly to a high base, expects mid-single-digit full-year DPS growth, is confident in medium-term double-digit VNB growth, and keeps Overweight, TP HK$85.
    • Friday close (AASTOCKS, 30 Oct 2026 16:08 HKT). Last HK$49.740, open/prev close 49.620, day 49.060–50.150, volume 39.82M, turnover HK$1.98B. Hang Seng Index 23,294 (+1.46%). Market Closed.

    Why a −93.7% profit print is not a broken insurer

    Under IFRS 17 / IFRS 9, a big chunk of an insurer’s equity book is marked through profit and loss. When A-shares fall in a quarter, reported net profit swings hard, and Ping An’s Q3 is a textbook case. Operating profit is the metric management and analysts use to strip that noise out, and it rose 8.3% in both Q3 and 9M.

    That is why the dividend debate matters more than the headline. Ping An’s dividend policy is tied to operating profit, not reported net profit, so a resilient operating line plus Morgan Stanley’s mid-single-digit DPS growth call supports a yield floor around 6% at current prices.

    What still has to go right

    1. A-shares stabilise. Another quarter of equity correction means more fair-value noise and more negative headlines, even if operating profit holds.
    2. VNB growth resumes. The high-base excuse covers one quarter; the medium-term double-digit VNB thesis needs proof in 2027.
    3. Dividend delivered. Mid-single-digit DPS growth keeps the yield case intact; a cut would break it.
    4. Technical repair. Reclaim SMA20 50.24, then SMA50 52.98, to escape the downtrend channel.

    Ping An 02318 stock analysis: valuation and key numbers

    MetricPing An (02318)
    Last price (30 Oct 16:08)HK$49.740
    Day change+HK$0.120 (+0.242%)
    Prev close / openHK$49.620 / HK$49.620
    Day rangeHK$49.060 – 50.150
    52-week rangeHK$47.680 – 74.700
    Market cap / circulating (H)HK$900.67B / 370.44B
    P/E / TTM P/E (EPS HK$8.5453)5.821x / 4.767x
    P/B (NAV HK$61.497)0.809x
    Dividend yield / TTM / DPS6.136% / 6.322% / HK$3.0518
    Payout35.713%
    SMA 10 / 20 / 5049.081 / 50.238 / 52.984
    SMA 100 / 25054.101 / 59.637
    RSI 1440.864
    MACD (12,26) / signal / div−1.146 / −1.229 / 0.083
    Volume / turnover39.82M / HK$1.98B
    Short-sell ratio (30/10)20.567%
    Data: AASTOCKS, updated 30 Oct 2026 16:08 HKT, market Closed; quotes delayed. SMA20, RSI and MACD from the AASTOCKS daily chart.
    Results and commentary checkpointsFigure
    Q3 revenue / YoY~RMB 153.0bn / −54%
    Q3 net profit / YoYRMB 4.06bn / −93.7%
    9M revenue / YoYRMB 728.13bn / −12.6%
    9M net profit / YoYRMB 96.65bn / −27.3% (H1: +36.1%)
    Q3 / 9M after-tax operating profit~RMB 41.7bn / ~RMB 125.9bn (both +8.3%)
    Customers (end-Sep)~256m
    12-month retention, 3+ categories99%
    Morgan StanleyOverweight, TP HK$85
    Commentary PE / yield~5.8x trailing; 6.15% trailing, ~6.5% expected
    Commentary stanceKeep holding; medium-term target HK$70
    Source: figures cited in market commentary notes and Morgan Stanley broker research; AASTOCKS for the quote table. 億 = 100m: 40.60億 = RMB 4.06bn; 966.45億 = RMB 96.645bn.

    What the numbers tell us (our analysis):

    • The PE figures line up. Commentary’s ~5.8x trailing PE matches AASTOCKS’ headline P/E 5.821x. AASTOCKS also shows a lower TTM P/E of 4.767x; we quote both and anchor on 5.8x.
    • The yield is roughly the same too. Commentary cites 6.15% trailing; AASTOCKS shows 6.136% (TTM 6.322%) on DPS HK$3.0518. The ~6.5% forward figure is the commentary’s estimate, not an AASTOCKS print.
    • Below book. P/B 0.81x against NAV HK$61.50 prices in a lot of bad news for a franchise growing operating profit 8%.
    • Payout has room. A ~36% payout leaves space for the DPS growth Morgan Stanley expects.
    • Shorts are active. A 20.6% short-sell ratio means rallies will be contested.

    Technical analysis: still inside the downtrend channel

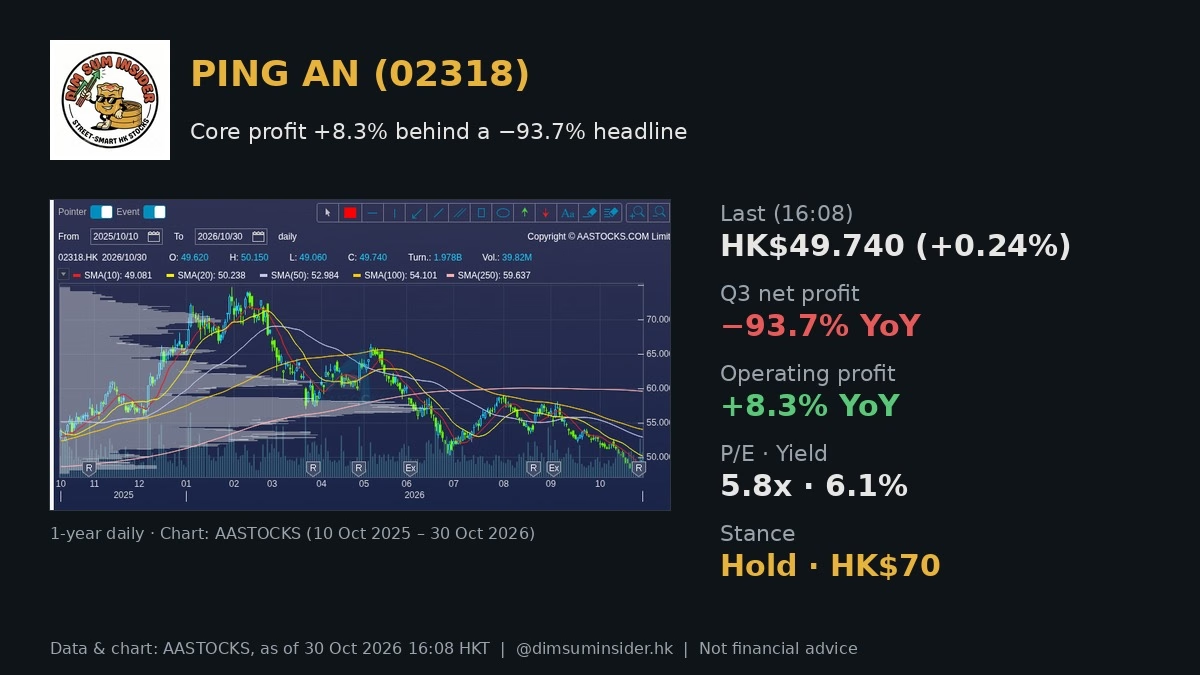
    Ping An (02318) one-year daily chart on AASTOCKS
    Source: AASTOCKS, as of 30 Oct 2026 16:08 HKT; 1-year daily chart

    The AASTOCKS one-year daily chart (10 Oct 2025 to 30 Oct 2026) shows a run from the mid-50s to a high near HK$74.70 in early 2026, then a steady staircase of lower highs and lower lows into the high-40s. The price sits just above SMA10 49.08 but below SMA20 50.24, SMA50 52.98, SMA100 54.10 and SMA250 59.64, a fully bearish moving-average stack.

    • Momentum is basing. RSI(14) 40.9 has turned up from the low-30s, and MACD (−1.146) has just crossed above its signal (−1.229) with a positive divergence of +0.083. That is an early turn, not a trend change.
    • Support. The 52-week low HK$47.68 is the line that matters; the day low 49.06 comes first.
    • Resistance. HK$50.15–50.24 (day high / SMA20), then HK$52.98 (SMA50) and ~54.1 (SMA100). A close above SMA50 would be the first real break of the channel.

    Bull case vs bear case

    Bull case

    • Operating profit +8.3% in Q3 and 9M; the net-profit collapse is mark-to-market noise.
    • About 5.8x PE, 0.81x book and a ~6.1% yield (commentary expects ~6.5%).
    • Morgan Stanley Overweight, TP HK$85; mid-single-digit DPS growth; double-digit VNB growth medium term.
    • A cross-selling franchise: 256m customers, 99% retention for 3+ category holders.
    • MACD bullish crossover and RSI rising from oversold territory near the 52-week low.

    Bear case

    • A-share weakness keeps hitting reported profit; headlines stay ugly.
    • Single-quarter VNB was weak; the high-base explanation needs confirming next year.
    • Fully bearish SMA stack; the downtrend channel since early 2026 is intact.
    • Short-sell ratio above 20%.
    • China rates and the property/credit backdrop weigh on investment yields.

    Levels to watch

    1. HK$47.68 (52-week low). A break would invalidate the base and open new lows.
    2. HK$49.06–49.08 (day low / SMA10). Near-term pivot.
    3. HK$50.15–50.24 (day high / SMA20). First repair level.
    4. HK$52.98 (SMA50). Channel-break confirmation.
    5. HK$54.1 / 59.6 (SMA100 / SMA250). Heavier supply on the way to the HK$70 medium-term target.
    6. Fundamentals. A-share direction, Q4 VNB and the final DPS.

    The DimSumInsider take

    Ping An is a value-and-yield hold with a mark-to-market headache, not a broken story. The franchise grew after-tax operating profit 8.3% while the A-share correction wiped out reported Q3 profit. At 5.8x earnings, 0.81x book and a ~6% yield backed by operating profit, the commentary’s keep-holding call and HK$70 medium-term target look reasonable, and Morgan Stanley’s HK$85 is the upside case. Our approach: hold core positions while HK$47.68 holds, add on a close above SMA50 (HK$52.98), and collect the dividend while waiting. The edge here is patience, because the market is pricing the noise and not the engine.

    FAQ

    Why did Ping An’s Q3 net profit fall 93.7%?

    Mainly fair-value losses on equity investments as China’s A-share market corrected in Q3. After-tax operating profit, which strips out short-term investment swings, rose 8.3% to about RMB 41.7bn.

    Is Ping An’s dividend safe?

    The dividend is linked to operating profit, which is growing. Morgan Stanley expects mid-single-digit full-year DPS growth. AASTOCKS shows a 6.136% yield (TTM 6.322%) with a ~36% payout.

    What are the key Ping An valuation numbers?

    At AASTOCKS 16:08 HKT on 30 Oct 2026 (HK$49.740, market Closed): P/E 5.821x (TTM 4.767x), P/B 0.809x, yield 6.136%, market cap HK$900.67B. Commentary’s ~5.8x PE and 6.15% yield are consistent with this.

    What price targets are out there?

    Market commentary notes set a medium-term target of HK$70 with a keep-holding stance. Morgan Stanley rates Ping An Overweight with a HK$85 target.

    What levels matter for 02318?

    Support HK$49.06 then the 52-week low HK$47.68; resistance HK$50.24 (SMA20), HK$52.98 (SMA50), HK$54.1 (SMA100) and HK$59.6 (SMA250).


    Disclaimer: For information only. Based on public market commentary notes, Morgan Stanley broker research as reported, and AASTOCKS data as of 30 Oct 2026 16:08 HKT (market Closed); data may be delayed. DimSumInsider may hold positions not stated here. Consult a licensed financial adviser. This is not financial advice. Do your own research.
  • China Hongqiao (01378): Valuation Low, Play the Rebound — Target HK$25

    China Hongqiao (01378): Valuation Low, Play the Rebound — Target HK$25

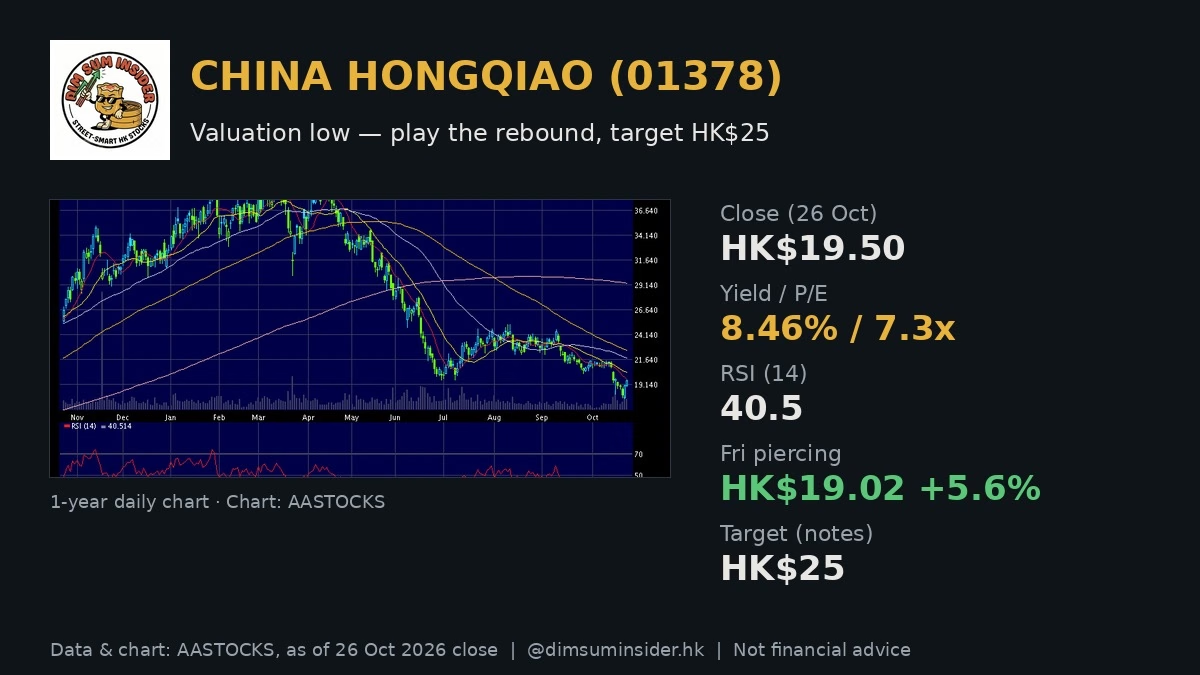
    China Hongqiao (01378) — English name CHINAHONGQIAO on AASTOCKS — closed Monday at HK$19.50, after a Friday rebound candle that market commentary notes flagged as a low-level piercing pattern (破腳穿頭). This China Hongqiao 01378 stock analysis asks the alpha question: with a trailing yield near 8.5%, a single-digit P/E, and an integrated bauxite-to-aluminum chain still printing strong H1 and Q3 growth, is the sell-off from the March double-top a gift for a rebound toward HK$25?

    Market commentary notes say valuation is low enough to play the rebound, citing historical P/E near 7.2x sliding toward about 5.5x forward, historical yield as high as 8.675% with room toward 10%, and a HK$25 target. Monday’s AASTOCKS tape already sits a touch above Friday’s HK$19.02 close.

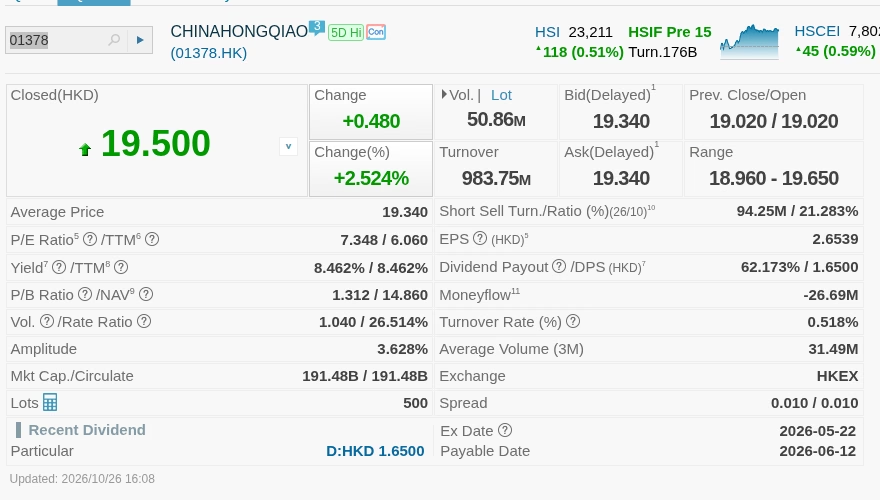
    China Hongqiao (01378) detailed quote on AASTOCKS, 26 Oct 2026 close
    Source: AASTOCKS, as of 26 Oct 2026 close

    The news in brief

    • HSI context (last Friday). Market commentary notes: Hang Seng Index closed about 23,093 (+158). Over a 4-day week (3 down, 1 up) the index still lost about 1,093 points on the weekly candle, but the daily print was a doji / “cross morning star” (十字胎) — short-term rebound talk, not a trend reversal claim.
    • 01378 Friday tape + piercing pattern. Closed HK$19.02 (+5.55%). Commentary marks a low-level 破腳穿頭 bullish candle as a short-term buy signal, with low valuation and high yield as the rebound conditions even if the market stays choppy.
    • Integrated chain. Domestic aluminum leader with vertical integration: bauxite → alumina → aluminum → high-end aluminum-alloy processing.
    • H1 results (RMB, 億 check). Revenue 875.16億 = RMB 87.516bn (+8% YoY); net profit 172.1億 = RMB 17.21bn (+39.2% YoY), helped by higher aluminum prices. Alloy ASP +18.7% to RMB 21,200/t; deep-processed ASP +13.4% to RMB 23,400/t; gross margin +5.8ppt to 31.5%.
    • Q3 (subsidiary Hongqiao Holdings). Quarterly revenue +16.54% to 448.76億 = RMB 44.876bn; net profit +55.6% YoY to 77.02億 = RMB 7.702bn (softer QoQ), on higher aluminum prices and lower finance costs. Commentary: a softer aluminum price need not wreck the group.
    • Why the stock corrected. March double-top near HK$41.2; LME aluminum from about US$3,752/t peak to roughly US$3,000/t — prior overshoot, Middle East supply shock milder than feared, faster electrolytic-aluminum capacity (e.g. Indonesia), stronger USD.
    • Morgan Stanley cited. China electrolytic-aluminum 45mt capacity ceiling as a hard supply constraint; Southwest supply-disruption risk; capacity relocation plus optimised power/coal costs; integrated chain supporting the profit base. Yield seen rising toward 10%; hist P/E ~7.2x → ~5.5x forward; rebound target HK$25.
    • Monday tape (AASTOCKS, 26 Oct close). Last HK$19.50 (+0.48 / +2.524%), prev 19.02, open 19.02, day 18.96–19.65. Markets closed for the session; cite AASTOCKS.

    Why the integrated chain still matters

    China Hongqiao is not a pure smelter trade. The commentary thesis is that owning the stack from bauxite through alumina and primary metal into alloy processing cushions margins when spot aluminum wobbles — which is exactly the setup after the spring spike faded. H1 already showed ASP gains and a 5.8-point gross-margin lift to 31.5%. The Q3 print at Hongqiao Holdings kept YoY profit growth above 50% even as QoQ profit cooled, which the notes read as evidence that a US$3,000 aluminum tape is survivable for this structure.

    The broker overlay is supply, not demand heroics: a national 45 million-ton electrolytic-aluminum cap, Southwest tightness risk, and cost wins from capacity moves and power/coal optimisation. That is a scarcity-plus-cost story sitting under a stock that has already halved from the March double-top.

    What still has to go right

    1. Aluminum holds a floor. Another sharp slide below ~US$3,000 would test the “price pullback is not fatal” claim.
    2. Yield stays credible. The 8%+ trailing yield and the 10% path assume payout discipline as earnings roll forward.
    3. The piercing pattern follows through. One bullish Friday candle plus a firm Monday close is a start; reclaiming the declining SMAs is the real technical test.

    China Hongqiao 01378 stock analysis: valuation and key numbers

    MetricChina Hongqiao (01378)
    Last price (26 Oct close)HK$19.50
    Day change+HK$0.48 (+2.524%)
    Prev close / openHK$19.02 / HK$19.02
    Day rangeHK$18.96 – 19.65
    52-week rangeHK$17.75 – 41.36
    Market capHK$191.48B
    P/E / TTM P/E (EPS 2.6539)7.348x / 6.060x
    P/B (NAV 14.860)1.312x
    Dividend yield / DPS8.462% / HK$1.65
    SMA 10 / 20 / 5019.699 / 20.386 / 21.795
    SMA 100 / 25022.57 / 29.345
    RSI 1440.51
    MACD (12,26) / signal / div-0.825 / -0.706 / -0.119
    Volume / turnover50.86M / HK$983.75M
    Short-sell ratio (26/10, half-day)21.283%
    Data: AASTOCKS, updated 26 Oct 2026 16:08 HKT, market closed. English name: CHINAHONGQIAO.
    Operating / commentary checkpointsFigure
    Fri close / change (commentary)HK$19.02 / +5.55% (piercing pattern)
    H1 revenue / profitRMB 87.516bn (+8%) / RMB 17.21bn (+39.2%)
    Alloy / deep-proc ASPRMB 21,200/t (+18.7%) / RMB 23,400/t (+13.4%)
    Gross margin31.5% (+5.8ppt)
    Q3 rev / profit (Hongqiao Holdings)RMB 44.876bn (+16.54%) / RMB 7.702bn (+55.6% YoY)
    Hist P/E → fwd / hist yield → path~7.2x → ~5.5x / 8.675% → toward 10%
    Rebound target (commentary)HK$25
    Source: figures cited in market commentary notes; AASTOCKS for the quote table. 億 units converted: 875.16億 = RMB 87.516bn.

    What the numbers tell us (our analysis):

    • Single-digit multiple after a deep reset. AASTOCKS P/E 7.35x / TTM 6.06x sits next to the commentary’s ~7.2x historical and ~5.5x forward path — this is no longer a March-peak valuation.
    • Yield is the floor. Trailing yield 8.46% (DPS HK$1.65) is already near the commentary’s 8.675% historical high-water mark; a path toward 10% is the bullish broker stretch, not a guarantee.
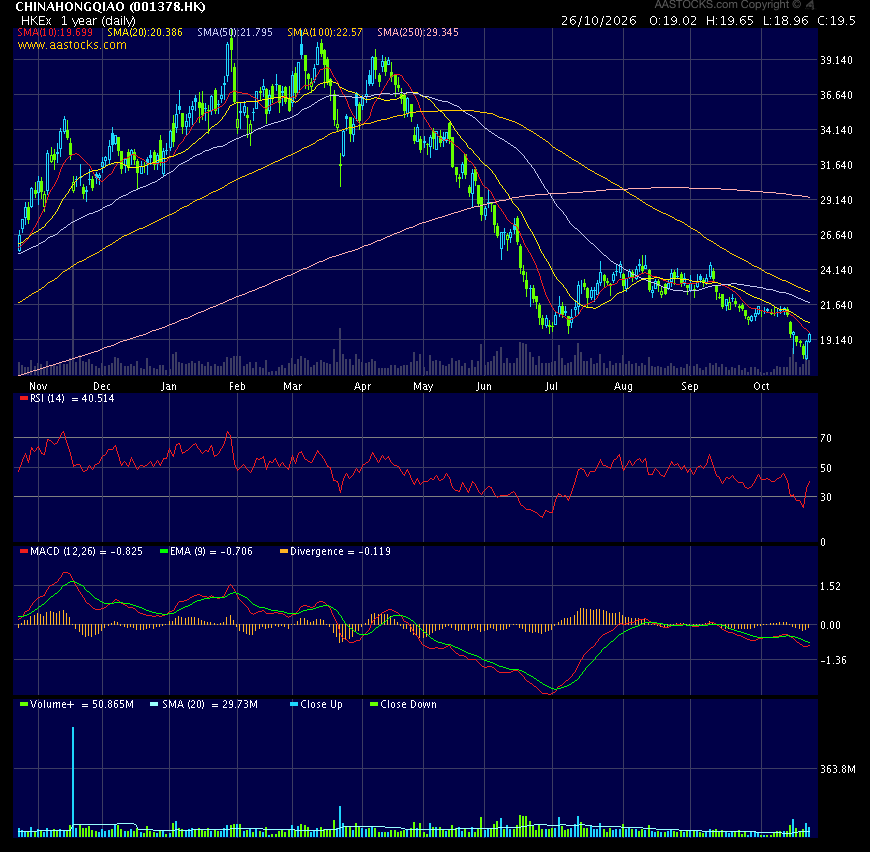
    • Price is still under every listed SMA. SMA10 19.70 through SMA250 29.35 — bearish stack. Monday’s HK$19.50 is just under the 10-day line; reclaiming it is step one.
    • RSI mid-weak, not washed-out. RSI(14) 40.5 is below 50 but above classic oversold — room for either a grind higher or another shakeout.
    • MACD still negative. MACD -0.825 vs signal -0.706 (div -0.119) keeps the medium-term momentum bearish until a cross up sticks.
    • Shorts are loud. A 21.3% half-day short-sell ratio is elevated — fuel for a squeeze if the rebound continues, and fuel for a flush if it fails.

    Technical analysis: piercing pattern under a bearish SMA stack

    China Hongqiao (01378) 1-year daily chart on AASTOCKS
    Source: AASTOCKS, as of 26 Oct 2026 close

    The one-year AASTOCKS chart is a round trip from a spring spike above HK$40 into the high teens. Friday’s commentary candle at HK$19.02 (+5.55%) was labelled a low-level piercing pattern (破腳穿頭) — a bullish reversal hint after the slide. Monday followed through to HK$19.50 on 50.86M shares (well above the chart’s ~29.7M 20-day volume average), but price remains below the 10- through 250-day averages.

    • First job: SMA10. Resistance starts at HK$19.70 (SMA10), then HK$20.39 (SMA20) and HK$21.80 (SMA50).
    • Commentary target HK$25 sits near a natural mean-reversion waypoint between the 50- and 100-day area on the way up from here — not a retest of HK$41.
    • Support. Day low HK$18.96, then the 52-week low HK$17.75. A break of 17.75 voids the rebound thesis for sizing purposes.
    • HSI tape. Friday’s 十字胎 bounce context matters less than whether Hongqiao can hold above Friday’s low while shorts stay heavy.

    Levels: first resistance HK$19.70 (SMA10) and HK$20.39 (SMA20); commentary target HK$25; support HK$18.96 then HK$17.75 (52w low).

    Bull case vs bear case

    Bull case

    • Integrated chain (bauxite → alumina → aluminum → alloys) plus H1 margin expansion to 31.5%.
    • H1 profit +39.2%; Q3 subsidiary profit +55.6% YoY despite softer QoQ.
    • MS supply narrative: 45mt China cap, Southwest tightness, power/coal cost optimisation.
    • Yield ~8.5% with a cited path toward 10%; hist P/E ~7.2x → ~5.5x forward.
    • Friday piercing pattern + Monday follow-through; 21% short ratio can squeeze.
    • Commentary rebound target HK$25.

    Bear case

    • Price still below all five listed SMAs; MACD histogram negative.
    • Aluminum already slid from ~US$3,752 to ~US$3,000; another leg down hits earnings optics.
    • Stock is ~53% below the 52-week high of HK$41.36 — dead-cat risk after a waterfall.
    • Short-sell ratio ~21% can amplify a failed rebound.
    • Q3 profit cooler QoQ; “yield to 10%” is a broker expectation, not a declared payout.

    Levels to watch

    1. HK$19.70 (SMA10). First reclaim for the rebound to look technical, not just a one-day bounce.
    2. HK$20.39 (SMA20). Momentum confirmation line.
    3. HK$21.80 (SMA50). Intermediate trend repair.
    4. HK$25. Market-commentary rebound target.
    5. HK$18.96 / HK$17.75. Monday low and 52-week low — break of 17.75 ends the “play the rebound” setup for us.
    6. LME aluminum near US$3,000/t. Fundamental swing factor behind the de-rating.

    The DimSumInsider take

    China Hongqiao is a high-yield, single-digit P/E aluminum integrator after a brutal de-rating from the March double-top — not a momentum breakout. The fundamental print (H1 margin + Q3 YoY profit) and the MS supply/cost stack support the commentary’s rebound call, but the chart still owes the bulls a reclaim of the 10- and 20-day averages. Our approach: treat HK$19.70–20.40 as the prove-it band, keep HK$25 as the commentary waypoint (not a moonshot back to HK$41), and size with a hard line under HK$17.75. The alpha is being paid ~8.5% to wait while testing whether the piercing pattern was the turn — with shorts heavy enough to help if it is.

    FAQ

    What does China Hongqiao (01378) do?

    China Hongqiao is a Hong Kong-listed aluminum producer with an integrated chain from bauxite mining through alumina and primary aluminum into high-end aluminum-alloy processing. AASTOCKS lists the English name as CHINAHONGQIAO.

    Why are market commentary notes bullish now?

    They flag low valuation, high yield, a Friday piercing-pattern candle at HK$19.02 (+5.55%), strong H1/Q3 growth, and a Morgan Stanley-linked view that yield could move toward 10% with forward P/E near 5.5x and a HK$25 rebound target.

    What are the key China Hongqiao valuation numbers?

    At the 26 Oct 2026 close of HK$19.50 (AASTOCKS): P/E 7.35x, TTM P/E 6.06x, P/B 1.31x, yield 8.46%, market cap HK$191.48B. RSI(14) 40.5; price below SMA10–SMA250.

    What levels matter for 01378?

    Resistance HK$19.70 (SMA10), HK$20.39 (SMA20), HK$21.80 (SMA50), commentary target HK$25; support HK$18.96 then HK$17.75 (52-week low).

    Is this a buy after the March collapse?

    That depends on your risk tolerance. The yield and multiple are attractive on the commentary’s terms, but the SMA stack and MACD are still bearish. Use levels and a stop; this is not financial advice.


    Disclaimer: For information only. Based on public market commentary notes and AASTOCKS data as of 26 Oct 2026 close; data may be delayed. DimSumInsider may hold positions not stated here. Consult a licensed financial adviser. This is not financial advice. Do your own research.
  • Harbin Electric (01133): Profits Up 63%, Stock Down 61%. Is the HK$9–11 Buy Zone Here?

    Harbin Electric (01133): Profits Up 63%, Stock Down 61%. Is the HK$9–11 Buy Zone Here?

    Seven straight months of selling have taken Harbin Electric (01133) from a record HK$28.88 in March to HK$11.25 at Thursday’s close, a new 52-week low and a drop of about 61%. This Harbin Electric 01133 stock analysis asks the alpha question: profits are still growing at double-digit pace, so has the sell-off gone too far, and is the market handing out a high-yield power-equipment name at a single-digit P/E?

    Market commentary notes argue yes: after the valuation reset, HEC looks attractive, with an accumulation zone of HK$9–11 and a target of HK$15. Thursday’s slide below the HK$11.63 close cited in that commentary means the stock is now knocking on the door of that zone.

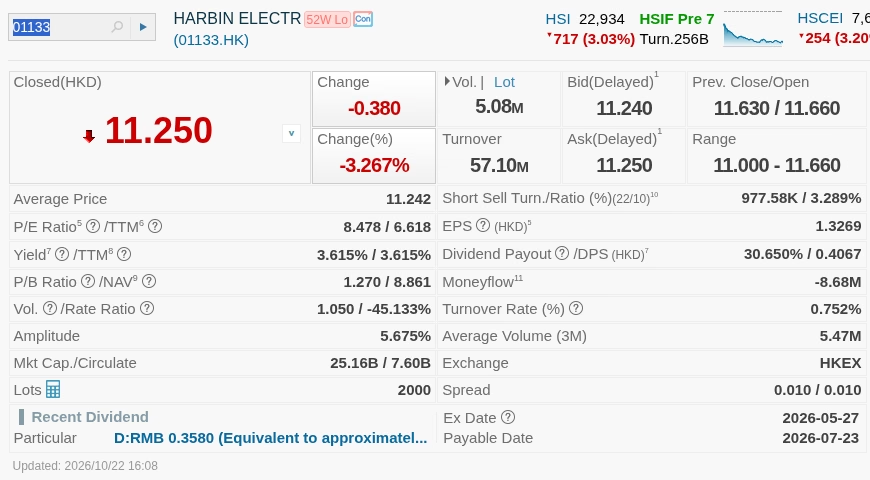
    Harbin Electric (01133) detailed quote on AASTOCKS, 21 Oct 2026 close
    Source: AASTOCKS, as of 21 Oct 2026 close

    The news in brief

    • Record high to 52-week low. HEC hit a record HK$28.88 in March and then fell for seven straight months to HK$11.63 on 21 Oct. On 22 Oct it lost another 3.3% to HK$11.25, a new 52-week low (AASTOCKS).
    • Weak tape. The Hang Seng Index opened higher and closed lower on 21 Oct, dragged by weak US tech, and sentiment in Hong Kong remains fragile.
    • Earnings still climbing. Market commentary notes that HEC turned around from 2022, with net profit rising sharply each year since on a low base. For 1H2026, revenue rose 10.3% to about RMB24.8bn, net profit jumped 63.5% to about RMB1.718bn, and gross margin improved 2.95 points to about 15%.
    • Why the stock fell anyway: the market expects coal-power equipment orders to peak and roll over as China sharply cuts new coal-power approvals (“good news fully priced”), peer Dongfang Electric (01072) had targets cut, and brokers trimmed HEC targets from about HK$32 to about HK$30 while lowering EPS forecasts.
    • Valuation was stretched at the top. At the March high, HEC traded on roughly 22x trailing earnings. Today AASTOCKS shows a P/E of 8.5x and a TTM P/E of 6.6x.
    • Order book is deep. Total backlog is estimated at over RMB100bn. 1H2026 new orders were RMB36.04bn (+1.35%), with new-type power equipment orders of RMB27.1bn (+41.19%), per company interim data cited in the commentary.
    • The call: forward yield of about 5.2%, accumulate at HK$9–11, target HK$15.

    Fundamentals: profits up, stock down

    This is the classic “results beat, stock sinks” setup. The 1H numbers are good: double-digit sales growth, profit up nearly two-thirds and a near three-point margin expansion. The problem is not the last six months, it is the next three years. China has sharply cut new coal-power approvals, and coal-fired units have been a key driver of the order boom across HEC and Dongfang Electric. When investors think orders have peaked, they stop paying for growth even while reported earnings keep rising.

    The bull counter is the order book. A backlog estimated at more than RMB100bn, against roughly RMB50bn of annualised revenue on our maths from the 1H run-rate, gives about two years of work already in hand. New orders held steady at RMB36.04bn in the half, and the new-type power equipment category grew 41%, which suggests the mix is shifting rather than collapsing.

    Management has also been selective. Market commentary notes that HEC optimised its order strategy, delivering or releasing low-margin legacy contracts, while higher-margin orders signed in recent years should support relatively high growth for the next three years. That is consistent with the 2.95-point gross-margin gain.

    Why the de-rating happened

    1. Coal-power peak fears. Fewer new approvals means fewer future boiler and turbine orders.
    2. Sector read-across. Target cuts at Dongfang Electric (01072) hit the whole group.
    3. Starting valuation. A run to HK$28.88 at about 22x trailing P/E left no room for disappointment. Broker targets slipped from about HK$32 to about HK$30, and the stock fell anyway.

    Harbin Electric 01133 stock analysis: valuation and key numbers

    MetricHarbin Electric (01133)
    Last price (22 Oct close)HK$11.25
    Day change-HK$0.38 (-3.27%)
    Prev close / openHK$11.63 / HK$11.66
    Day rangeHK$11.00 – 11.66
    52-week rangeHK$11.33 – 28.88 (new 52-week low)
    Market cap (H-share circulating)HK$25.16B (HK$7.60B)
    P/E (EPS 1.3269)8.48x
    TTM P/E6.62x
    P/B (NAV/share 8.861)1.27x
    Dividend yield / DPS / payout3.62% / 0.4067 / 30.65%
    SMA 10 / 20 / 5012.446 / 13.110 / 14.813
    SMA 100 / 25015.599 / 17.884
    RSI 10 / 14 / 2020.30 / 24.49 / 29.49 (oversold)
    MACD (12,26) / signal / divergence-0.850 / -0.719 / -0.13
    Volume / turnover5.08M / HK$57.10M
    Short selling ratio (half-day)3.29%
    Data: AASTOCKS, updated 22 Oct 2026 16:08 HKT, market closed.

    What the numbers tell us (our analysis):

    • Single-digit P/E on growing profits. A TTM P/E of 6.6x below the 8.5x headline P/E means trailing earnings are already running above base-year EPS: the 1H profit jump is in the numbers. Market commentary estimates the P/E falls to about 5.8x on this year’s earnings if full-year profit grows around 50%.
    • Yield is the floor. The trailing yield is 3.6% on a ~30% payout. Market commentary notes that if the payout is maintained, the forward yield is about 5.2% at HK$11.63; at HK$11.25 that edges higher on our maths.
    • Near book value. At 1.27x NAV of HK$8.86, the bottom of the HK$9–11 buy zone is close to book.
    • HK$15 is upside, not a moonshot. The target is about 33% above Thursday’s close and sits roughly at the 50- to 100-day moving averages, a sensible mean-reversion level.
    • Shorts are not the story. A 3.3% short ratio says this is long holders exiting, not a crowded short.

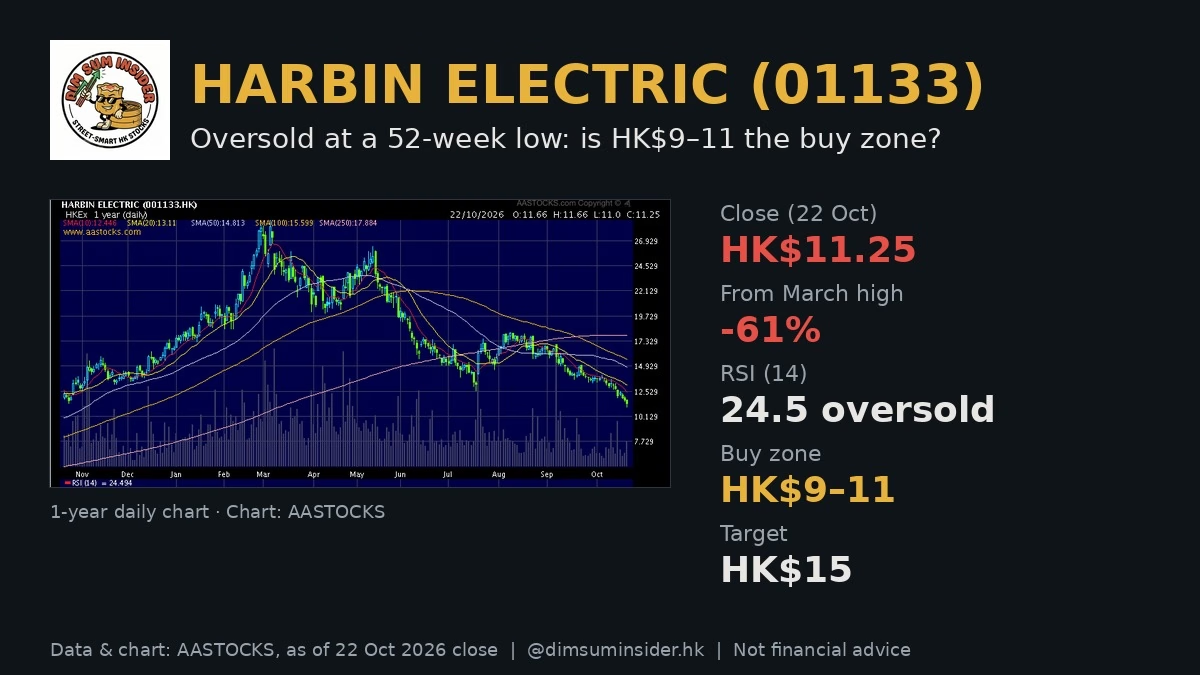
    Technical analysis: oversold, but still falling

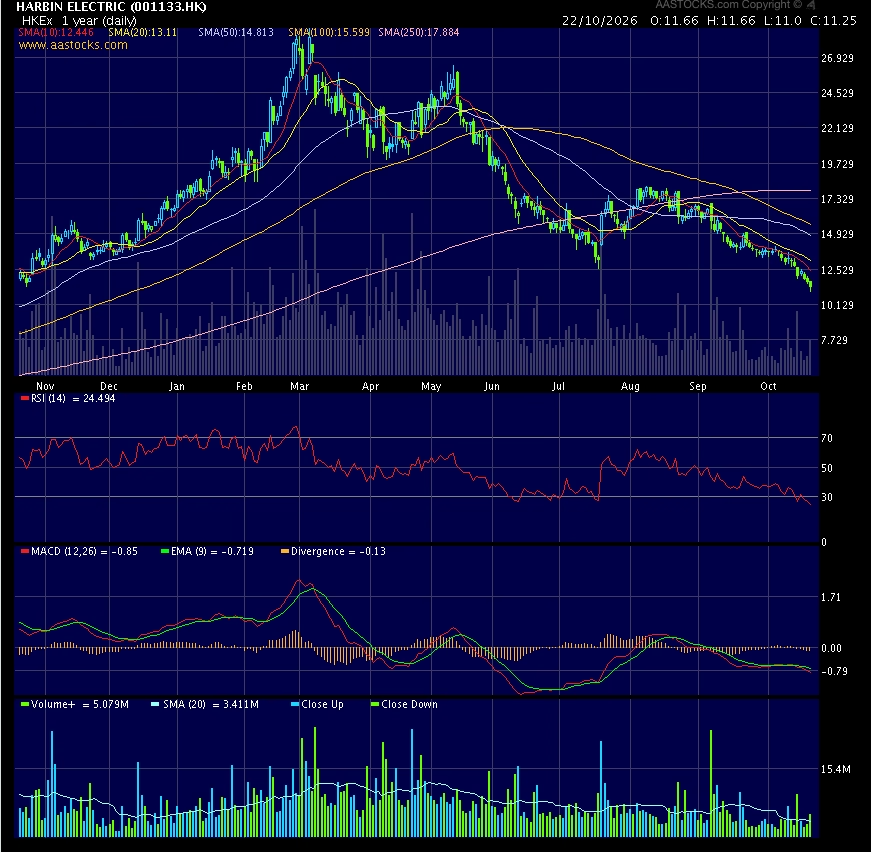
    Harbin Electric (01133) 1-year daily chart on AASTOCKS
    Chart: AASTOCKS, 1-year daily, as of 21 Oct 2026

    The one-year chart is a round trip: a steep rally into the March record high, then a seven-month staircase down. Price is below all five listed AASTOCKS SMAs (10, 20, 50, 100 and 250 days), stacked in bearish order from 12.4 up to 17.9. That is a textbook downtrend.

    Momentum is stretched to the downside:

    • Deeply oversold. RSI(10) at 20.3 and RSI(14) at 24.5 are well below 30.
    • MACD not turning yet. MACD at -0.85 is below its -0.719 signal line, a -0.13 divergence. No bullish cross yet.
    • Fresh low on a down day. The intraday low of HK$11.00 undercut the prior 52-week low of HK$11.33. Bulls need that to be the flush.

    Levels: support at HK$11.00 (Thursday’s low), then HK$9–11 (the commentary’s accumulation zone, near book value). First resistance is the 10-day SMA at HK$12.45, then the 20-day at HK$13.11 and the HK$14.8–15.6 band of the 50- and 100-day lines, which lines up with the HK$15 target.

    Bull case vs bear case

    Bull case

    • 1H net profit +63.5% and gross margin +2.95 points: earnings momentum is real.
    • Order book estimated at over RMB100bn, with high-margin orders seen supporting growth for three years.
    • Forward yield about 5.2% if the ~30% payout holds, at a P/E of 6.6x TTM.
    • RSI in the 20s and a 61% drawdown: a lot of bad news is already in the price.

    Bear case

    • China’s sharp cut in coal-power approvals could make 2026 the order peak.
    • Broker EPS cuts and Dongfang Electric target cuts show the sector narrative has turned.
    • Price is below every moving average and MACD has not crossed up: no confirmation of a bottom.
    • A weak Hang Seng tape driven by US tech can keep pressure on any rebound.

    Levels to watch

    1. HK$11.00 on a closing basis. Thursday’s intraday low and the top of the buy zone.
    2. HK$9–11 accumulation zone. Market commentary’s staged buy range, near book value.
    3. HK$12.45 / 13.11. Reclaiming the 10- and 20-day SMAs would be the first sign the slide is over.
    4. HK$15 target. Coincides with the 50- and 100-day SMA band.
    5. New-order data. Watch whether new-type power equipment orders keep offsetting coal-power weakness.

    The DimSumInsider take

    Harbin Electric is a good-results, bad-chart stock. Profits are growing fast, the backlog is deep and the yield case is building, but the market is pricing a coal-power order cliff. At 6.6x trailing earnings, 1.27x book and a forward yield around 5%, a lot of that fear is already in the price. Our approach: the HK$9–11 zone is where you scale in, not chase, and you want the 10-day line back before adding size. The alpha is collecting yield while the market argues about 2027 orders.

    FAQ

    Why has Harbin Electric (01133) fallen so much?

    The market expects coal-power equipment orders to peak as China sharply cuts new coal-power approvals, peer Dongfang Electric had targets cut, and brokers lowered HEC targets and EPS forecasts. The stock fell from a HK$28.88 record in March to HK$11.25 on 22 Oct 2026 (AASTOCKS).

    How did Harbin Electric do in 1H2026?

    Revenue rose 10.3% to about RMB24.8bn, net profit rose 63.5% to about RMB1.718bn and gross margin improved 2.95 points to about 15%.

    What is the target price for 01133?

    Market commentary sets a HK$15 target with an accumulation zone of HK$9–11.

    What is Harbin Electric’s dividend yield?

    AASTOCKS shows a trailing yield of 3.62% on a 30.65% payout. Market commentary estimates a forward yield of about 5.2% if the payout is maintained.

    What are the key technical levels?

    Support at HK$11.00 and the HK$9–11 zone; resistance at HK$12.45 (10-day SMA), HK$13.11 (20-day) and HK$14.8–15.6 (50- and 100-day). RSI(14) is 24.5, oversold.


    Disclaimer: For information only. Based on public market commentary notes, company interim data and AASTOCKS data as of 22 Oct 2026 close; data may be delayed. DimSumInsider may hold positions not stated here. Consult a licensed financial adviser. This is not financial advice. Do your own research.