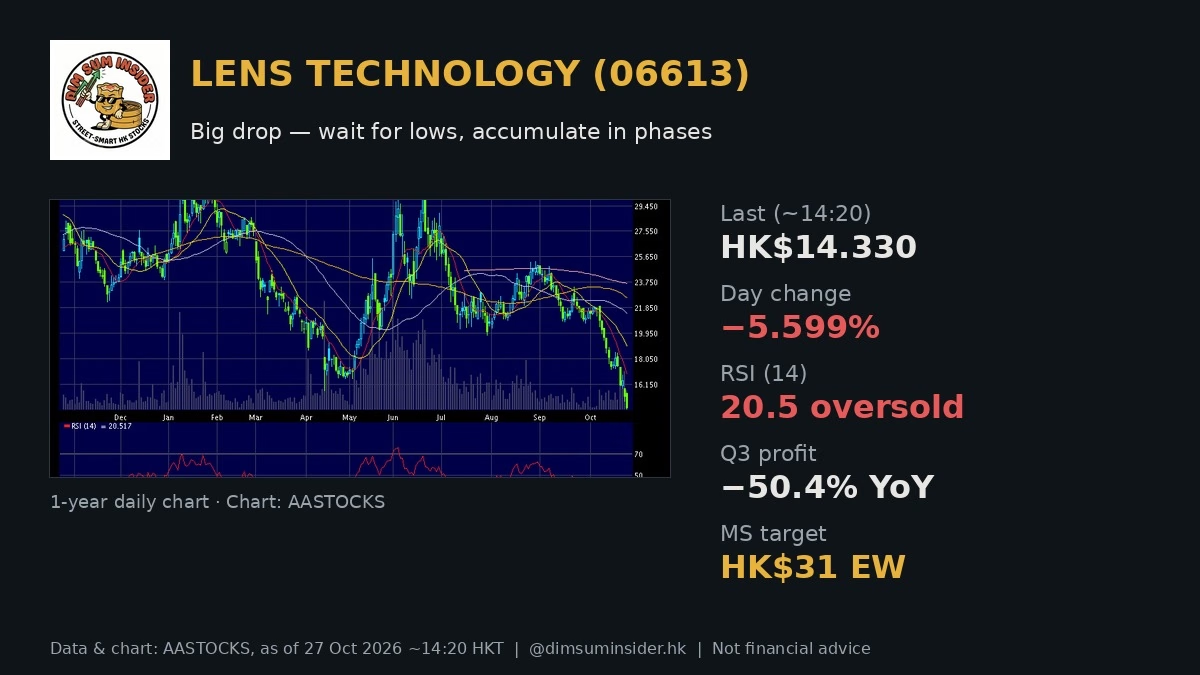
Tag: Oversold

  • Lens Technology (06613): Big Drop — Wait for Lows, Accumulate in Phases

    Lens Technology (06613): Big Drop — Wait for Lows, Accumulate in Phases

    Lens Technology (06613) — English name LENS / Lens Technology Company Limited on AASTOCKS — traded near HK$14.330 mid-session on 27 Oct (−0.850 / −5.599%), after yesterday’s close at HK$15.18. This Lens Technology 06613 stock analysis asks the alpha question: with RSI(14) deep in oversold at 20.5, a Q3 profit miss driven partly by a ~RMB 500m FX hit, and Morgan Stanley still Equal-weight at HK$31, is the waterfall from the late-August ~HK$25 area an accumulate-in-phases setup — or still falling knives?

    Market commentary notes say the drop is large enough to wait for lows and accumulate in phases, citing Apple-supply-chain / AI / space-concept volatility, a Q3 print that badly missed consensus, and a view that the sell-off may be excessive for the long term even as short-term sentiment stays soft.
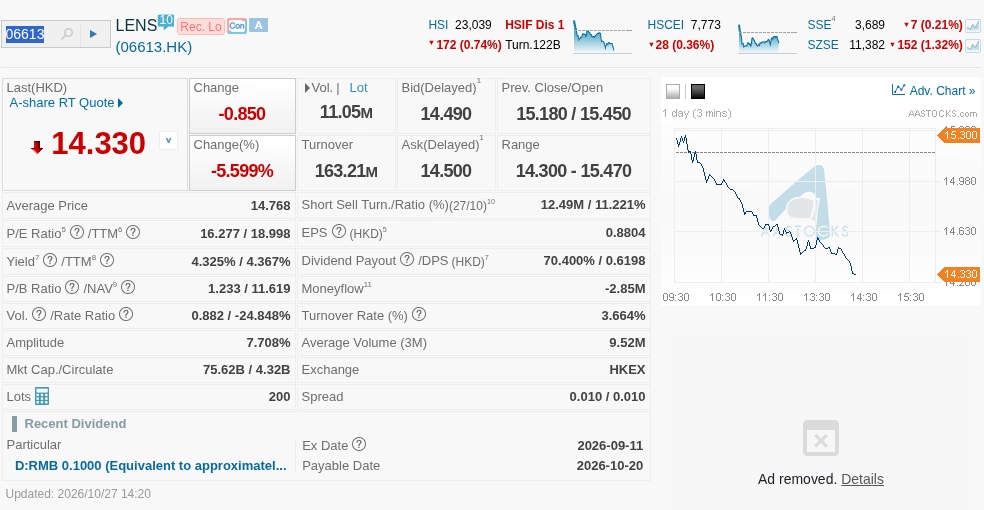
    Lens Technology (06613) detailed quote on AASTOCKS, 27 Oct 2026 ~14:20 HKT
    Source: AASTOCKS, as of 27 Oct 2026 ~14:20 HKT

    The news in brief

    • Volatile tape. Commentary: after the H-share listing, Jul–Oct last year the stock rose over 70% from about HK$18.6 to HK$32.6; a May rebound this year nearly doubled again. Concepts: Apple supply chain (果鏈), AI, space tech. From late August ~HK$25 it fell to yesterday’s close HK$15.18 (clipping chart: −1.21 / −7.4%).
    • Q3 miss (RMB, 億 check). Revenue about 190.3億 = RMB 19.03bn (−8.05% YoY) — market had expected single-digit growth on autumn flagship stocking; peak season instead shrank slightly. Net profit attributable to parent 8.4億 = RMB 840m (−50.42% YoY), far below mainstream broker forecasts of 14–16億 = RMB 1.4–1.6bn.
    • FX + ramp costs. Nearly 5億 = RMB 500m FX loss from RMB appreciation (USD settlements) eroded more than half of period net profit. High fixed costs and yield-ramp expenses for AI terminal hardware, foldables, and NEV precision parts also pressed margins.
    • Margins. H1/Q2 gross margin rose against the trend to >18% (UTG, auto large-screen assemblies, AI thermal modules). Q3 GPM fell 1.4ppt QoQ to 16.8%; ex-FX, comprehensive GPM seen stable in a 16–18% band.
    • Three variables. (1) AI phones / AI glasses adoption around 2027; (2) NEV second curve — central-control panels, B-pillar sensors, panoramic sunroof glass; (3) FX hedging and cost control (more forward FX locks).
    • Morgan Stanley cited. Equal-weight (與大市同步); on a 2027 20x P/E the valuation is “not cheap”; maintains target HK$31. Short-term soft on the miss; drop may be excessive — wait for further weakness to accumulate with a better margin of safety.
    • Tuesday tape (AASTOCKS, updated 27 Oct 2026 ~14:20 HKT). Last HK$14.330 (−0.850 / −5.599%), prev 15.180, open 15.450, day 14.300–15.470. Market still open/moving; cite AASTOCKS and the timestamp. Today’s low 14.300 is a new low not yet reflected in the saved 52-week historical row (14.840–32.580).

    Why the Apple / AI / NEV stack still matters

    Lens is a classic 果鏈 + AI hardware + auto glass name: cover glass, metal frames, thermal modules, foldable UTG, and rising vehicle display content. Commentary’s point is not that Q3 was fine — it wasn’t — but that the FX hit and capacity/yield ramp for next-cycle products can make one quarter look worse than the underlying franchise. Strip the ~RMB 500m FX drag and the notes argue the core business “did not lose pace,” with an ex-FX GPM band of 16–18%.

    The broker overlay is patience, not chase: MS keeps Equal-weight and HK$31 on a 2027 20x frame that it still calls “not cheap,” while other houses cut ratings but leave targets well above the tape. That is a margin-of-safety story after a slide from ~25 to the mid-teens — not a momentum breakout.

    What still has to go right

    1. AI upgrade cycle lands. Phones and glasses adoption by ~2027 has to lift ASP on thermal, frames, and cover glass.
    2. NEV content scales. Central control, B-pillar sensing, and sunroof glass need to become a real second growth curve, not just a slide-deck line.
    3. FX and costs behave. Hedging and yield ramp must stop eating half the quarter’s profit again.

    Lens Technology 06613 stock analysis: valuation and key numbers

    MetricLens Technology (06613)
    Last price (27 Oct ~14:20)HK$14.330
    Day change−HK$0.850 (−5.599%)
    Prev close / openHK$15.180 / HK$15.450
    Day rangeHK$14.300 – 15.470
    52-week historical (saved row)HK$14.840 – 32.580
    Market cap / circulateHK$75.62B / 4.32B
    P/E / TTM P/E (EPS 0.8804)16.277x / 18.998x
    P/B (NAV 11.619)1.233x
    Dividend yield4.325%
    SMA 10 / 20 / 5016.926 / 18.995 / 21.431
    SMA 100 / 25022.572 / 23.644
    RSI 1420.517 (oversold)
    MACD (12,26) / signal / div−1.747 / −1.315 / −0.432
    Volume / turnover11.05M / HK$163.21M
    Short-sell ratio (27/10, half-day)11.221%
    Data: AASTOCKS, updated 27 Oct 2026 14:20 HKT, market still open/moving. English name: LENS / Lens Technology Company Limited. Today’s low 14.300 is a new low vs the saved 52w historical low 14.840.
    Operating / commentary checkpointsFigure
    Yesterday close (commentary)HK$15.18 (−1.21 / −7.4%)
    Late-2024 rally~HK$18.6 → 32.6 (+70%+)
    Late-Aug → yesterday~HK$25 → 15.18
    Q3 revenue / YoYRMB 19.03bn / −8.05%
    Q3 net profit / YoYRMB 840m / −50.42%
    Consensus profit bandRMB 1.4–1.6bn
    FX loss (commentary)~RMB 500m
    Q3 GPM / QoQ16.8% / −1.4ppt
    MS rating / targetEqual-weight / HK$31
    Source: figures cited in market commentary notes; AASTOCKS for the quote table. 億 units converted: 190.3億 = RMB 19.03bn; 8.4億 = RMB 840m; 近5億 ≈ RMB 500m.

    What the numbers tell us (our analysis):

    • Multiple is not a deep-value gift. AASTOCKS P/E 16.3x / TTM 19.0x sits next to MS’s “20x 2027 is not cheap” line — this is an oversold quality-cyclical, not a 7x aluminum yield trade.
    • Yield is modest. Trailing yield 4.33% helps a little but is not the floor thesis.
    • Price is crushed under every listed SMA. SMA10 16.93 through SMA250 23.64 — full bearish stack. Mid-session 14.33 is ~15% under the 10-day line.
    • RSI is washed-out. RSI(14) 20.5 is classic oversold — historically where bounce traders lean in, and where knives still cut.
    • MACD still deeply negative. MACD −1.747 vs signal −1.315 (div −0.432) keeps medium-term momentum bearish until a cross up sticks.
    • Shorts are present, not extreme. Half-day short-sell 11.2% can fuel either a squeeze or another flush.

    Technical analysis: new lows under a bearish SMA stack
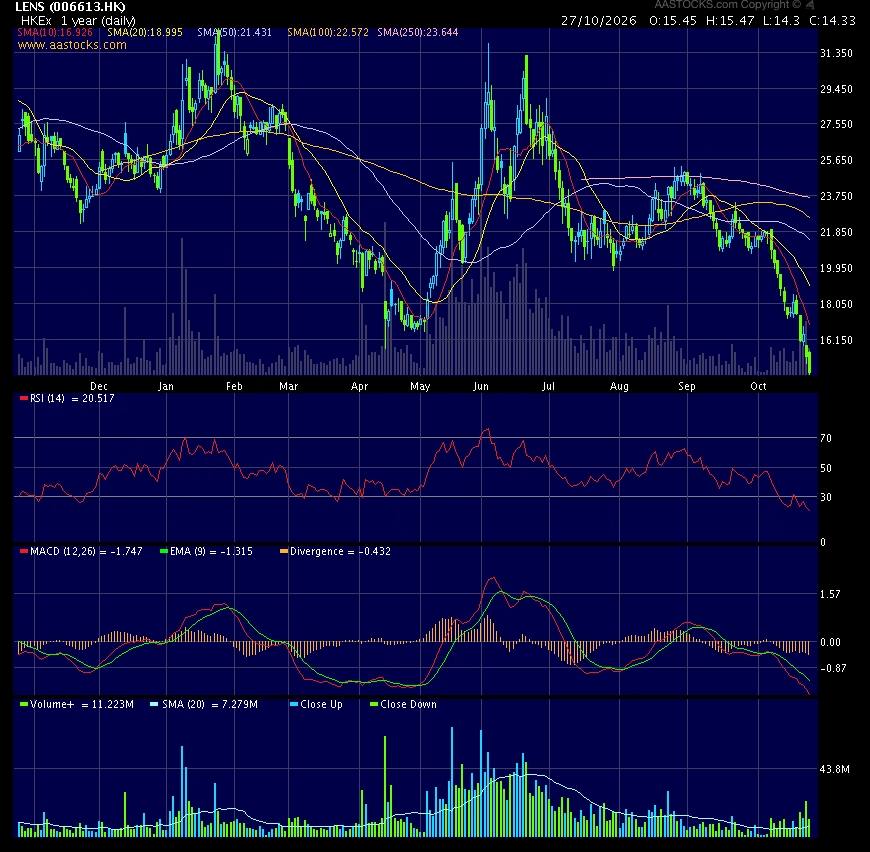
    Lens Technology (06613) 1-year daily chart on AASTOCKS
    Source: AASTOCKS, as of 27 Oct 2026 ~14:20 HKT

    The one-year AASTOCKS chart is a round trip from the ~HK$32.6 zone into the mid-teens. Price has sliced through every listed average; today’s print near HK$14.33 with day low 14.30 makes a new low versus the saved 52-week historical floor of 14.84. Volume ~11.05M vs the chart’s ~7.3M 20-day volume average shows active selling into weakness.

    • First job: stop the bleed, then SMA10. Resistance starts at HK$16.93 (SMA10), then HK$18.99 (SMA20) and HK$21.43 (SMA50).
    • Commentary / MS target HK$31 sits near the old highs — a long-cycle waypoint, not a near-term reclaim after this waterfall.
    • Support. Day low HK$14.30, then open air under the prior historical 52w low 14.84. A sustained break of 14.30 voids the “accumulate in phases” sizing for us until a base forms.
    • RSI 20.5 is the oversold fuel; MACD divergence still widening is the warning that oversold can stay oversold.

    Levels: first resistance HK$16.93 (SMA10) and HK$18.99 (SMA20); MS/commentary target HK$31; support HK$14.30 (today’s new low) then psychological HK$14.

    Bull case vs bear case

    Bull case

    • Apple / AI / foldable / NEV content stack; UTG and AI thermal already lifted H1/Q2 GPM above 18%.
    • ~RMB 500m FX loss and ramp costs explain a chunk of the Q3 profit crater — core may be healthier than the headline −50%.
    • Three growth variables (AI devices ~2027, NEV second curve, better FX hedge) are real optionality.
    • MS Equal-weight, target HK$31; other brokers’ targets still well above the tape.
    • RSI 20.5 oversold after a slide from ~25 / from 32.6 highs — drop may be excessive for long-term accumulation in phases.

    Bear case

    • Price below all five listed SMAs; MACD histogram deeply negative; new lows printing while the market is still open.
    • Q3 revenue −8% and profit −50% is a hard miss vs 1.4–1.6bn consensus — not just FX optics.
    • MS itself says 2027 20x is “not cheap” — valuation does not scream bargain on multiples alone.
    • High fixed costs and yield ramp for AI/foldable/NEV can keep margins soft for longer.
    • Concept-stock volatility (果鏈 / AI / space) cuts both ways — sentiment can keep selling oversold.

    Levels to watch

    1. HK$14.30 (today’s low). New-low line — hold vs break decides whether “accumulate in phases” has a floor.
    2. HK$16.93 (SMA10). First reclaim for any technical bounce to look real.
    3. HK$18.99 (SMA20). Momentum confirmation.
    4. HK$21.43 (SMA50). Intermediate trend repair.
    5. HK$31. MS / market-commentary target — long-cycle waypoint, not a near-term print.
    6. RMB / USD and AI-phone / glasses adoption. Fundamental swing factors behind the FX hit and the 2027 thesis.

    The DimSumInsider take

    Lens Technology is an oversold Apple-chain / AI-hardware / NEV-content name after a brutal slide from the high-20s/low-30s into the mid-teens — not a cheap single-digit P/E yield play. The fundamental print (Q3 −50% profit, FX ~RMB 500m, GPM 16.8%) justifies caution, but the commentary’s “wait for lows, accumulate in phases” frame fits a stock with RSI 20.5, a new day-low at 14.30, and broker targets still clustered near HK$31. Our approach: treat HK$14.30–16.93 as the prove-it band for any bounce, keep HK$31 as the MS waypoint (not a moonshot for next week), and size only in phases with a hard respect for open air under today’s low. The alpha is being patient while FX, yield ramp, and AI/NEV adoption decide whether this miss was a one-quarter scar or a trend break.

    FAQ

    What does Lens Technology (06613) do?

    Lens Technology is a Hong Kong-listed precision glass and structural-parts maker tied to the Apple supply chain, AI device hardware (covers, frames, thermal modules), foldables (UTG), and NEV displays/sensors. AASTOCKS lists the English name as LENS / Lens Technology Company Limited.

    Why are market commentary notes talking about accumulating now?

    They flag a large drop from ~HK$25 (late Aug) to HK$15.18 yesterday, a Q3 miss partly explained by ~RMB 500m FX losses and ramp costs, three medium-term growth variables (AI devices ~2027, NEV, FX/cost control), and an MS Equal-weight target of HK$31 — arguing the sell-off may be excessive for long-term phased buying.

    What are the key Lens Technology valuation numbers?

    At AASTOCKS ~14:20 HKT on 27 Oct 2026 (HK$14.330): P/E 16.28x, TTM P/E 19.00x, P/B 1.23x, yield 4.33%, market cap HK$75.62B. RSI(14) 20.5; price below SMA10–SMA250.

    What levels matter for 06613?

    Resistance HK$16.93 (SMA10), HK$18.99 (SMA20), HK$21.43 (SMA50), MS target HK$31; support HK$14.30 (today’s new low).

    Is this a buy after the Q3 miss?

    That depends on your risk tolerance. Oversold RSI and a large gap to broker targets support a phased-accumulate thesis, but new lows, a full bearish SMA stack, and a hard earnings miss argue for patience and small size. Use levels; this is not financial advice.


    Disclaimer: For information only. Based on public market commentary notes and AASTOCKS data as of 27 Oct 2026 ~14:20 HKT (market still open/moving); data may be delayed. DimSumInsider may hold positions not stated here. Consult a licensed financial adviser. This is not financial advice. Do your own research.
  • Harbin Electric (01133): Profits Up 63%, Stock Down 61%. Is the HK$9–11 Buy Zone Here?

    Harbin Electric (01133): Profits Up 63%, Stock Down 61%. Is the HK$9–11 Buy Zone Here?

    Seven straight months of selling have taken Harbin Electric (01133) from a record HK$28.88 in March to HK$11.25 at Thursday’s close, a new 52-week low and a drop of about 61%. This Harbin Electric 01133 stock analysis asks the alpha question: profits are still growing at double-digit pace, so has the sell-off gone too far, and is the market handing out a high-yield power-equipment name at a single-digit P/E?

    Market commentary notes argue yes: after the valuation reset, HEC looks attractive, with an accumulation zone of HK$9–11 and a target of HK$15. Thursday’s slide below the HK$11.63 close cited in that commentary means the stock is now knocking on the door of that zone.

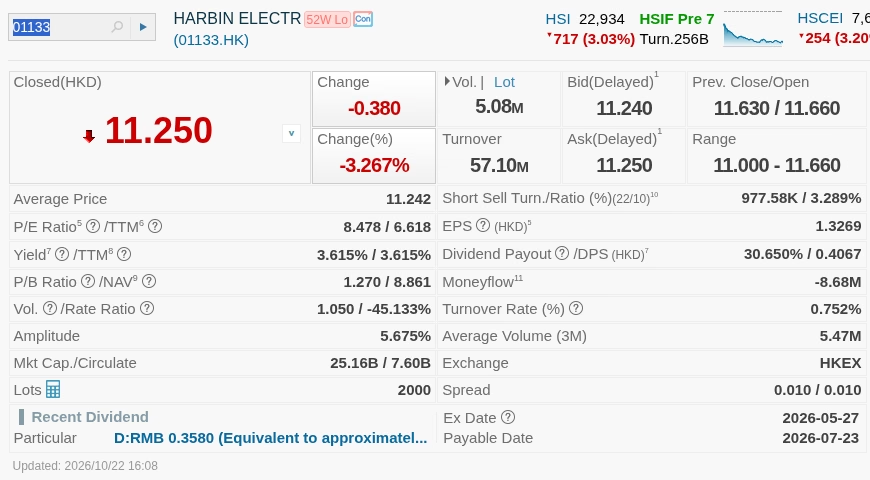
    Harbin Electric (01133) detailed quote on AASTOCKS, 21 Oct 2026 close
    Source: AASTOCKS, as of 21 Oct 2026 close

    The news in brief

    • Record high to 52-week low. HEC hit a record HK$28.88 in March and then fell for seven straight months to HK$11.63 on 21 Oct. On 22 Oct it lost another 3.3% to HK$11.25, a new 52-week low (AASTOCKS).
    • Weak tape. The Hang Seng Index opened higher and closed lower on 21 Oct, dragged by weak US tech, and sentiment in Hong Kong remains fragile.
    • Earnings still climbing. Market commentary notes that HEC turned around from 2022, with net profit rising sharply each year since on a low base. For 1H2026, revenue rose 10.3% to about RMB24.8bn, net profit jumped 63.5% to about RMB1.718bn, and gross margin improved 2.95 points to about 15%.
    • Why the stock fell anyway: the market expects coal-power equipment orders to peak and roll over as China sharply cuts new coal-power approvals (“good news fully priced”), peer Dongfang Electric (01072) had targets cut, and brokers trimmed HEC targets from about HK$32 to about HK$30 while lowering EPS forecasts.
    • Valuation was stretched at the top. At the March high, HEC traded on roughly 22x trailing earnings. Today AASTOCKS shows a P/E of 8.5x and a TTM P/E of 6.6x.
    • Order book is deep. Total backlog is estimated at over RMB100bn. 1H2026 new orders were RMB36.04bn (+1.35%), with new-type power equipment orders of RMB27.1bn (+41.19%), per company interim data cited in the commentary.
    • The call: forward yield of about 5.2%, accumulate at HK$9–11, target HK$15.

    Fundamentals: profits up, stock down

    This is the classic “results beat, stock sinks” setup. The 1H numbers are good: double-digit sales growth, profit up nearly two-thirds and a near three-point margin expansion. The problem is not the last six months, it is the next three years. China has sharply cut new coal-power approvals, and coal-fired units have been a key driver of the order boom across HEC and Dongfang Electric. When investors think orders have peaked, they stop paying for growth even while reported earnings keep rising.

    The bull counter is the order book. A backlog estimated at more than RMB100bn, against roughly RMB50bn of annualised revenue on our maths from the 1H run-rate, gives about two years of work already in hand. New orders held steady at RMB36.04bn in the half, and the new-type power equipment category grew 41%, which suggests the mix is shifting rather than collapsing.

    Management has also been selective. Market commentary notes that HEC optimised its order strategy, delivering or releasing low-margin legacy contracts, while higher-margin orders signed in recent years should support relatively high growth for the next three years. That is consistent with the 2.95-point gross-margin gain.

    Why the de-rating happened

    1. Coal-power peak fears. Fewer new approvals means fewer future boiler and turbine orders.
    2. Sector read-across. Target cuts at Dongfang Electric (01072) hit the whole group.
    3. Starting valuation. A run to HK$28.88 at about 22x trailing P/E left no room for disappointment. Broker targets slipped from about HK$32 to about HK$30, and the stock fell anyway.

    Harbin Electric 01133 stock analysis: valuation and key numbers

    MetricHarbin Electric (01133)
    Last price (22 Oct close)HK$11.25
    Day change-HK$0.38 (-3.27%)
    Prev close / openHK$11.63 / HK$11.66
    Day rangeHK$11.00 – 11.66
    52-week rangeHK$11.33 – 28.88 (new 52-week low)
    Market cap (H-share circulating)HK$25.16B (HK$7.60B)
    P/E (EPS 1.3269)8.48x
    TTM P/E6.62x
    P/B (NAV/share 8.861)1.27x
    Dividend yield / DPS / payout3.62% / 0.4067 / 30.65%
    SMA 10 / 20 / 5012.446 / 13.110 / 14.813
    SMA 100 / 25015.599 / 17.884
    RSI 10 / 14 / 2020.30 / 24.49 / 29.49 (oversold)
    MACD (12,26) / signal / divergence-0.850 / -0.719 / -0.13
    Volume / turnover5.08M / HK$57.10M
    Short selling ratio (half-day)3.29%
    Data: AASTOCKS, updated 22 Oct 2026 16:08 HKT, market closed.

    What the numbers tell us (our analysis):

    • Single-digit P/E on growing profits. A TTM P/E of 6.6x below the 8.5x headline P/E means trailing earnings are already running above base-year EPS: the 1H profit jump is in the numbers. Market commentary estimates the P/E falls to about 5.8x on this year’s earnings if full-year profit grows around 50%.
    • Yield is the floor. The trailing yield is 3.6% on a ~30% payout. Market commentary notes that if the payout is maintained, the forward yield is about 5.2% at HK$11.63; at HK$11.25 that edges higher on our maths.
    • Near book value. At 1.27x NAV of HK$8.86, the bottom of the HK$9–11 buy zone is close to book.
    • HK$15 is upside, not a moonshot. The target is about 33% above Thursday’s close and sits roughly at the 50- to 100-day moving averages, a sensible mean-reversion level.
    • Shorts are not the story. A 3.3% short ratio says this is long holders exiting, not a crowded short.

    Technical analysis: oversold, but still falling

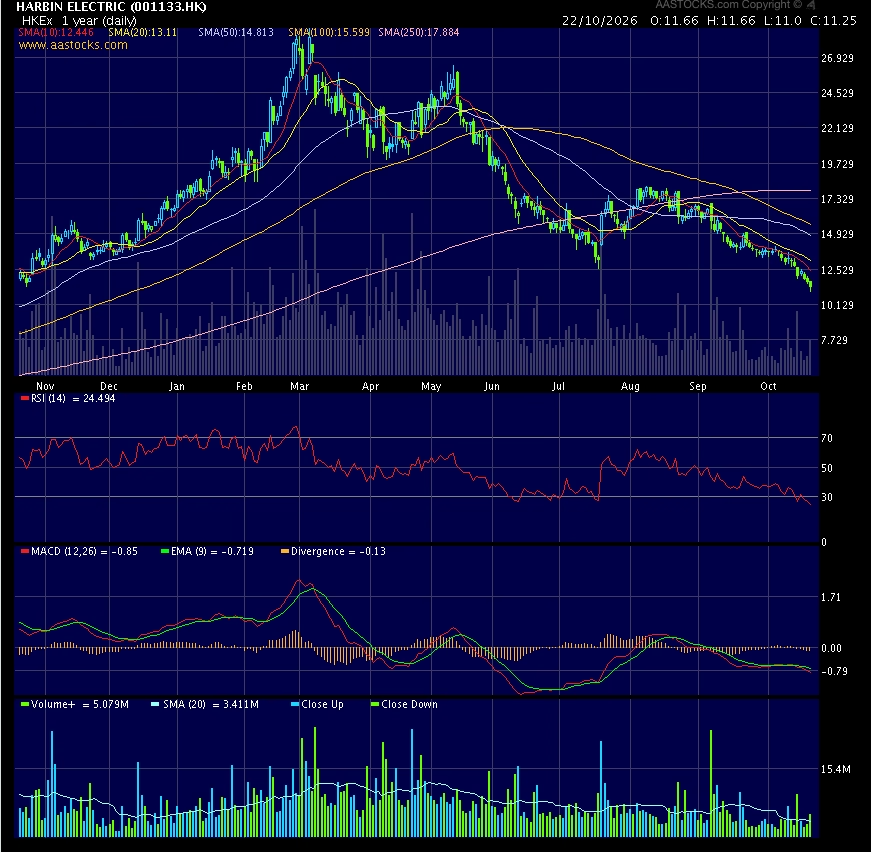
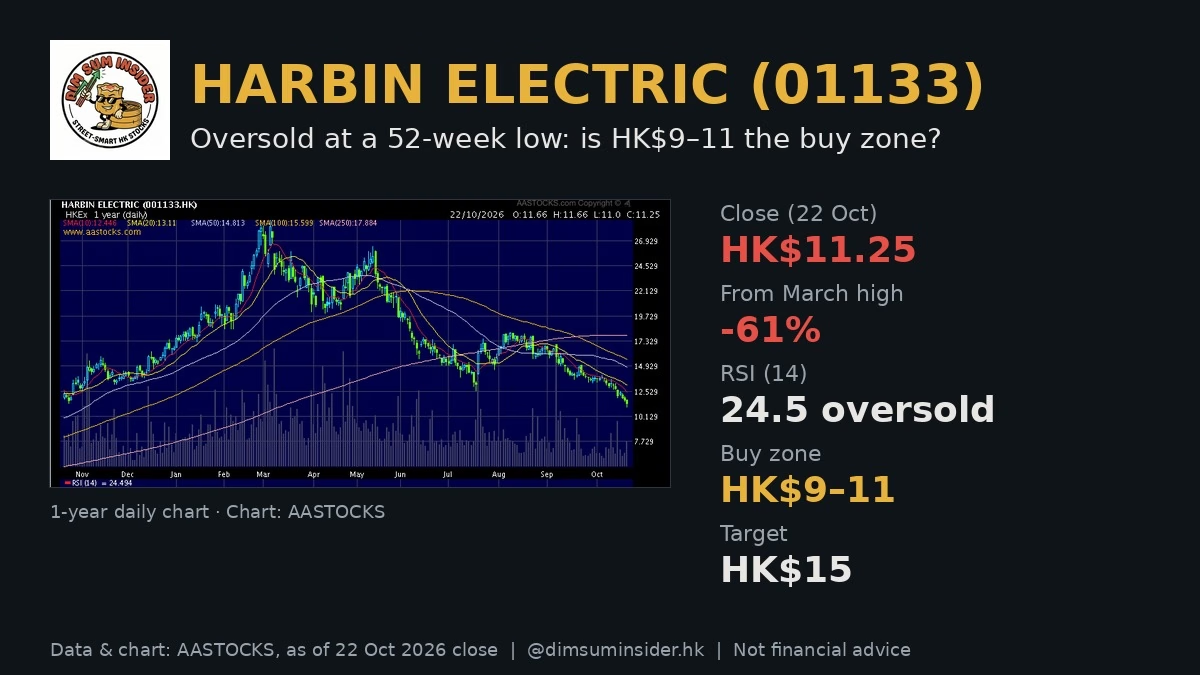
    Harbin Electric (01133) 1-year daily chart on AASTOCKS
    Chart: AASTOCKS, 1-year daily, as of 21 Oct 2026

    The one-year chart is a round trip: a steep rally into the March record high, then a seven-month staircase down. Price is below all five listed AASTOCKS SMAs (10, 20, 50, 100 and 250 days), stacked in bearish order from 12.4 up to 17.9. That is a textbook downtrend.

    Momentum is stretched to the downside:

    • Deeply oversold. RSI(10) at 20.3 and RSI(14) at 24.5 are well below 30.
    • MACD not turning yet. MACD at -0.85 is below its -0.719 signal line, a -0.13 divergence. No bullish cross yet.
    • Fresh low on a down day. The intraday low of HK$11.00 undercut the prior 52-week low of HK$11.33. Bulls need that to be the flush.

    Levels: support at HK$11.00 (Thursday’s low), then HK$9–11 (the commentary’s accumulation zone, near book value). First resistance is the 10-day SMA at HK$12.45, then the 20-day at HK$13.11 and the HK$14.8–15.6 band of the 50- and 100-day lines, which lines up with the HK$15 target.

    Bull case vs bear case

    Bull case

    • 1H net profit +63.5% and gross margin +2.95 points: earnings momentum is real.
    • Order book estimated at over RMB100bn, with high-margin orders seen supporting growth for three years.
    • Forward yield about 5.2% if the ~30% payout holds, at a P/E of 6.6x TTM.
    • RSI in the 20s and a 61% drawdown: a lot of bad news is already in the price.

    Bear case

    • China’s sharp cut in coal-power approvals could make 2026 the order peak.
    • Broker EPS cuts and Dongfang Electric target cuts show the sector narrative has turned.
    • Price is below every moving average and MACD has not crossed up: no confirmation of a bottom.
    • A weak Hang Seng tape driven by US tech can keep pressure on any rebound.

    Levels to watch

    1. HK$11.00 on a closing basis. Thursday’s intraday low and the top of the buy zone.
    2. HK$9–11 accumulation zone. Market commentary’s staged buy range, near book value.
    3. HK$12.45 / 13.11. Reclaiming the 10- and 20-day SMAs would be the first sign the slide is over.
    4. HK$15 target. Coincides with the 50- and 100-day SMA band.
    5. New-order data. Watch whether new-type power equipment orders keep offsetting coal-power weakness.

    The DimSumInsider take

    Harbin Electric is a good-results, bad-chart stock. Profits are growing fast, the backlog is deep and the yield case is building, but the market is pricing a coal-power order cliff. At 6.6x trailing earnings, 1.27x book and a forward yield around 5%, a lot of that fear is already in the price. Our approach: the HK$9–11 zone is where you scale in, not chase, and you want the 10-day line back before adding size. The alpha is collecting yield while the market argues about 2027 orders.

    FAQ

    Why has Harbin Electric (01133) fallen so much?

    The market expects coal-power equipment orders to peak as China sharply cuts new coal-power approvals, peer Dongfang Electric had targets cut, and brokers lowered HEC targets and EPS forecasts. The stock fell from a HK$28.88 record in March to HK$11.25 on 22 Oct 2026 (AASTOCKS).

    How did Harbin Electric do in 1H2026?

    Revenue rose 10.3% to about RMB24.8bn, net profit rose 63.5% to about RMB1.718bn and gross margin improved 2.95 points to about 15%.

    What is the target price for 01133?

    Market commentary sets a HK$15 target with an accumulation zone of HK$9–11.

    What is Harbin Electric’s dividend yield?

    AASTOCKS shows a trailing yield of 3.62% on a 30.65% payout. Market commentary estimates a forward yield of about 5.2% if the payout is maintained.

    What are the key technical levels?

    Support at HK$11.00 and the HK$9–11 zone; resistance at HK$12.45 (10-day SMA), HK$13.11 (20-day) and HK$14.8–15.6 (50- and 100-day). RSI(14) is 24.5, oversold.


    Disclaimer: For information only. Based on public market commentary notes, company interim data and AASTOCKS data as of 22 Oct 2026 close; data may be delayed. DimSumInsider may hold positions not stated here. Consult a licensed financial adviser. This is not financial advice. Do your own research.