
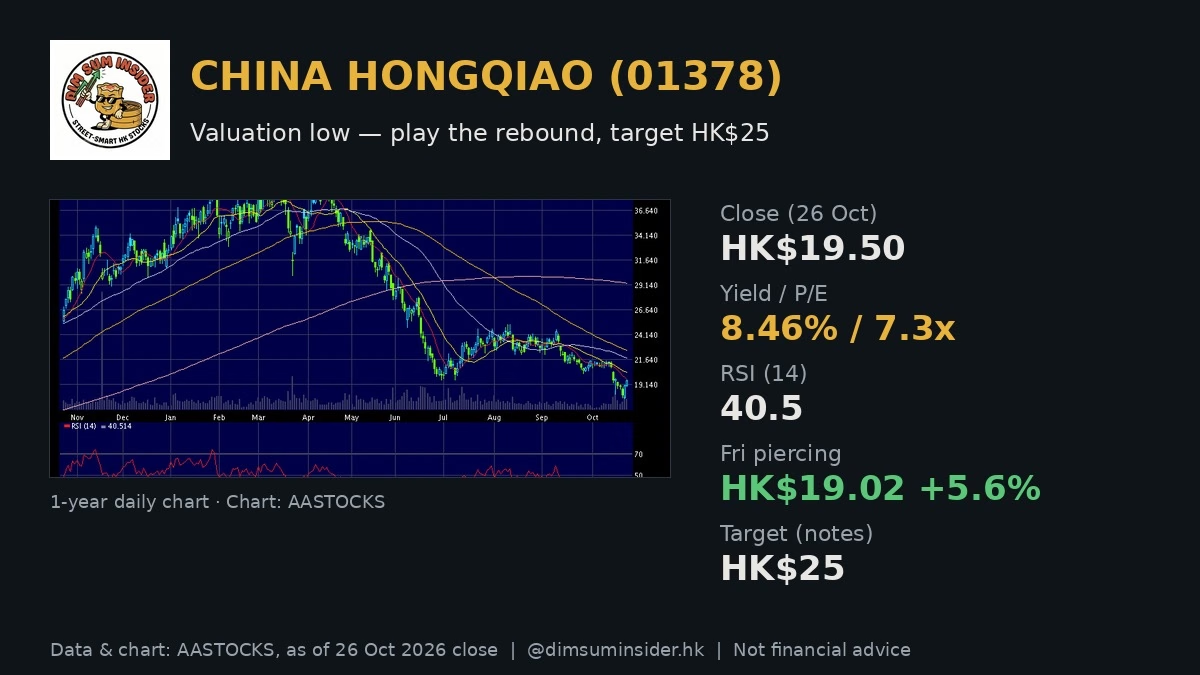
China Hongqiao (01378) — English name CHINAHONGQIAO on AASTOCKS — closed Monday at HK$19.50, after a Friday rebound candle that market commentary notes flagged as a low-level piercing pattern (破腳穿頭). This China Hongqiao 01378 stock analysis asks the alpha question: with a trailing yield near 8.5%, a single-digit P/E, and an integrated bauxite-to-aluminum chain still printing strong H1 and Q3 growth, is the sell-off from the March double-top a gift for a rebound toward HK$25?
Market commentary notes say valuation is low enough to play the rebound, citing historical P/E near 7.2x sliding toward about 5.5x forward, historical yield as high as 8.675% with room toward 10%, and a HK$25 target. Monday’s AASTOCKS tape already sits a touch above Friday’s HK$19.02 close.
The news in brief
- HSI context (last Friday). Market commentary notes: Hang Seng Index closed about 23,093 (+158). Over a 4-day week (3 down, 1 up) the index still lost about 1,093 points on the weekly candle, but the daily print was a doji / “cross morning star” (十字胎) — short-term rebound talk, not a trend reversal claim.
- 01378 Friday tape + piercing pattern. Closed HK$19.02 (+5.55%). Commentary marks a low-level 破腳穿頭 bullish candle as a short-term buy signal, with low valuation and high yield as the rebound conditions even if the market stays choppy.
- Integrated chain. Domestic aluminum leader with vertical integration: bauxite → alumina → aluminum → high-end aluminum-alloy processing.
- H1 results (RMB, 億 check). Revenue 875.16億 = RMB 87.516bn (+8% YoY); net profit 172.1億 = RMB 17.21bn (+39.2% YoY), helped by higher aluminum prices. Alloy ASP +18.7% to RMB 21,200/t; deep-processed ASP +13.4% to RMB 23,400/t; gross margin +5.8ppt to 31.5%.
- Q3 (subsidiary Hongqiao Holdings). Quarterly revenue +16.54% to 448.76億 = RMB 44.876bn; net profit +55.6% YoY to 77.02億 = RMB 7.702bn (softer QoQ), on higher aluminum prices and lower finance costs. Commentary: a softer aluminum price need not wreck the group.
- Why the stock corrected. March double-top near HK$41.2; LME aluminum from about US$3,752/t peak to roughly US$3,000/t — prior overshoot, Middle East supply shock milder than feared, faster electrolytic-aluminum capacity (e.g. Indonesia), stronger USD.
- Morgan Stanley cited. China electrolytic-aluminum 45mt capacity ceiling as a hard supply constraint; Southwest supply-disruption risk; capacity relocation plus optimised power/coal costs; integrated chain supporting the profit base. Yield seen rising toward 10%; hist P/E ~7.2x → ~5.5x forward; rebound target HK$25.
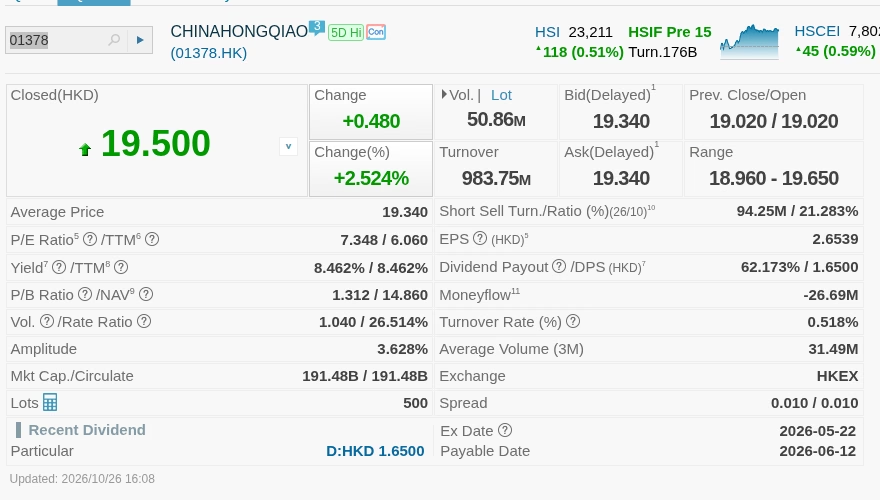
- Monday tape (AASTOCKS, 26 Oct close). Last HK$19.50 (+0.48 / +2.524%), prev 19.02, open 19.02, day 18.96–19.65. Markets closed for the session; cite AASTOCKS.
Why the integrated chain still matters
China Hongqiao is not a pure smelter trade. The commentary thesis is that owning the stack from bauxite through alumina and primary metal into alloy processing cushions margins when spot aluminum wobbles — which is exactly the setup after the spring spike faded. H1 already showed ASP gains and a 5.8-point gross-margin lift to 31.5%. The Q3 print at Hongqiao Holdings kept YoY profit growth above 50% even as QoQ profit cooled, which the notes read as evidence that a US$3,000 aluminum tape is survivable for this structure.
The broker overlay is supply, not demand heroics: a national 45 million-ton electrolytic-aluminum cap, Southwest tightness risk, and cost wins from capacity moves and power/coal optimisation. That is a scarcity-plus-cost story sitting under a stock that has already halved from the March double-top.
What still has to go right
- Aluminum holds a floor. Another sharp slide below ~US$3,000 would test the “price pullback is not fatal” claim.
- Yield stays credible. The 8%+ trailing yield and the 10% path assume payout discipline as earnings roll forward.
- The piercing pattern follows through. One bullish Friday candle plus a firm Monday close is a start; reclaiming the declining SMAs is the real technical test.
China Hongqiao 01378 stock analysis: valuation and key numbers
| Metric | China Hongqiao (01378) |
|---|---|
| Last price (26 Oct close) | HK$19.50 |
| Day change | +HK$0.48 (+2.524%) |
| Prev close / open | HK$19.02 / HK$19.02 |
| Day range | HK$18.96 – 19.65 |
| 52-week range | HK$17.75 – 41.36 |
| Market cap | HK$191.48B |
| P/E / TTM P/E (EPS 2.6539) | 7.348x / 6.060x |
| P/B (NAV 14.860) | 1.312x |
| Dividend yield / DPS | 8.462% / HK$1.65 |
| SMA 10 / 20 / 50 | 19.699 / 20.386 / 21.795 |
| SMA 100 / 250 | 22.57 / 29.345 |
| RSI 14 | 40.51 |
| MACD (12,26) / signal / div | -0.825 / -0.706 / -0.119 |
| Volume / turnover | 50.86M / HK$983.75M |
| Short-sell ratio (26/10, half-day) | 21.283% |
| Operating / commentary checkpoints | Figure |
|---|---|
| Fri close / change (commentary) | HK$19.02 / +5.55% (piercing pattern) |
| H1 revenue / profit | RMB 87.516bn (+8%) / RMB 17.21bn (+39.2%) |
| Alloy / deep-proc ASP | RMB 21,200/t (+18.7%) / RMB 23,400/t (+13.4%) |
| Gross margin | 31.5% (+5.8ppt) |
| Q3 rev / profit (Hongqiao Holdings) | RMB 44.876bn (+16.54%) / RMB 7.702bn (+55.6% YoY) |
| Hist P/E → fwd / hist yield → path | ~7.2x → ~5.5x / 8.675% → toward 10% |
| Rebound target (commentary) | HK$25 |
What the numbers tell us (our analysis):
- Single-digit multiple after a deep reset. AASTOCKS P/E 7.35x / TTM 6.06x sits next to the commentary’s ~7.2x historical and ~5.5x forward path — this is no longer a March-peak valuation.
- Yield is the floor. Trailing yield 8.46% (DPS HK$1.65) is already near the commentary’s 8.675% historical high-water mark; a path toward 10% is the bullish broker stretch, not a guarantee.
- Price is still under every listed SMA. SMA10 19.70 through SMA250 29.35 — bearish stack. Monday’s HK$19.50 is just under the 10-day line; reclaiming it is step one.
- RSI mid-weak, not washed-out. RSI(14) 40.5 is below 50 but above classic oversold — room for either a grind higher or another shakeout.
- MACD still negative. MACD -0.825 vs signal -0.706 (div -0.119) keeps the medium-term momentum bearish until a cross up sticks.
- Shorts are loud. A 21.3% half-day short-sell ratio is elevated — fuel for a squeeze if the rebound continues, and fuel for a flush if it fails.
Technical analysis: piercing pattern under a bearish SMA stack
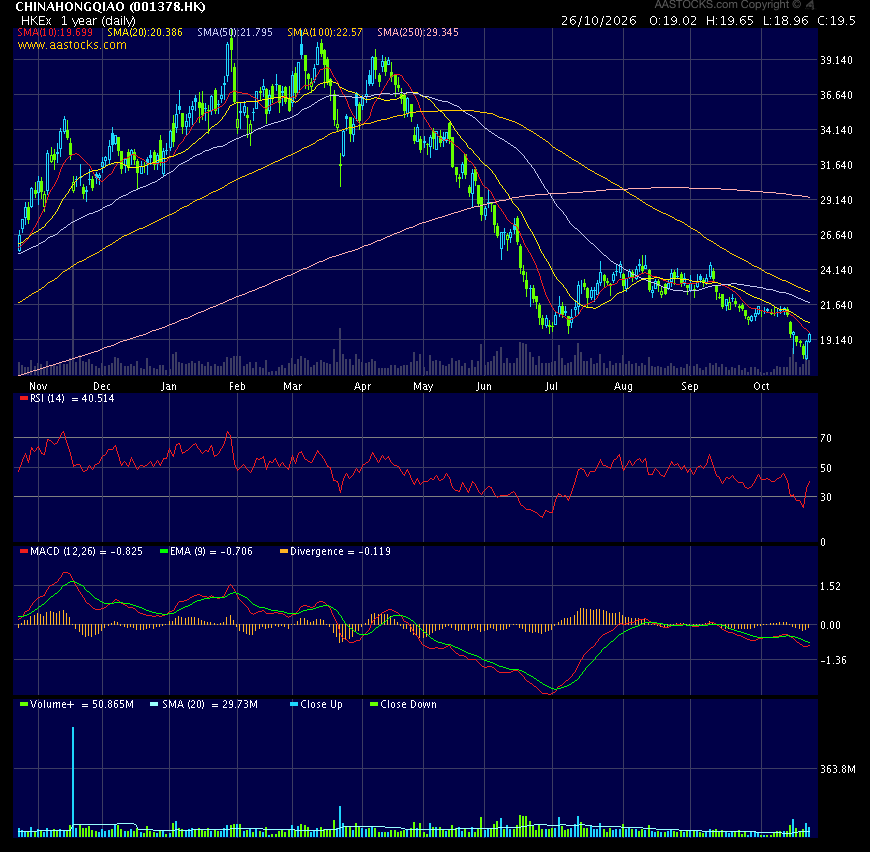
The one-year AASTOCKS chart is a round trip from a spring spike above HK$40 into the high teens. Friday’s commentary candle at HK$19.02 (+5.55%) was labelled a low-level piercing pattern (破腳穿頭) — a bullish reversal hint after the slide. Monday followed through to HK$19.50 on 50.86M shares (well above the chart’s ~29.7M 20-day volume average), but price remains below the 10- through 250-day averages.
- First job: SMA10. Resistance starts at HK$19.70 (SMA10), then HK$20.39 (SMA20) and HK$21.80 (SMA50).
- Commentary target HK$25 sits near a natural mean-reversion waypoint between the 50- and 100-day area on the way up from here — not a retest of HK$41.
- Support. Day low HK$18.96, then the 52-week low HK$17.75. A break of 17.75 voids the rebound thesis for sizing purposes.
- HSI tape. Friday’s 十字胎 bounce context matters less than whether Hongqiao can hold above Friday’s low while shorts stay heavy.
Levels: first resistance HK$19.70 (SMA10) and HK$20.39 (SMA20); commentary target HK$25; support HK$18.96 then HK$17.75 (52w low).
Bull case vs bear case
Bull case
- Integrated chain (bauxite → alumina → aluminum → alloys) plus H1 margin expansion to 31.5%.
- H1 profit +39.2%; Q3 subsidiary profit +55.6% YoY despite softer QoQ.
- MS supply narrative: 45mt China cap, Southwest tightness, power/coal cost optimisation.
- Yield ~8.5% with a cited path toward 10%; hist P/E ~7.2x → ~5.5x forward.
- Friday piercing pattern + Monday follow-through; 21% short ratio can squeeze.
- Commentary rebound target HK$25.
Bear case
- Price still below all five listed SMAs; MACD histogram negative.
- Aluminum already slid from ~US$3,752 to ~US$3,000; another leg down hits earnings optics.
- Stock is ~53% below the 52-week high of HK$41.36 — dead-cat risk after a waterfall.
- Short-sell ratio ~21% can amplify a failed rebound.
- Q3 profit cooler QoQ; “yield to 10%” is a broker expectation, not a declared payout.
Levels to watch
- HK$19.70 (SMA10). First reclaim for the rebound to look technical, not just a one-day bounce.
- HK$20.39 (SMA20). Momentum confirmation line.
- HK$21.80 (SMA50). Intermediate trend repair.
- HK$25. Market-commentary rebound target.
- HK$18.96 / HK$17.75. Monday low and 52-week low — break of 17.75 ends the “play the rebound” setup for us.
- LME aluminum near US$3,000/t. Fundamental swing factor behind the de-rating.
The DimSumInsider take
China Hongqiao is a high-yield, single-digit P/E aluminum integrator after a brutal de-rating from the March double-top — not a momentum breakout. The fundamental print (H1 margin + Q3 YoY profit) and the MS supply/cost stack support the commentary’s rebound call, but the chart still owes the bulls a reclaim of the 10- and 20-day averages. Our approach: treat HK$19.70–20.40 as the prove-it band, keep HK$25 as the commentary waypoint (not a moonshot back to HK$41), and size with a hard line under HK$17.75. The alpha is being paid ~8.5% to wait while testing whether the piercing pattern was the turn — with shorts heavy enough to help if it is.
FAQ
What does China Hongqiao (01378) do?
China Hongqiao is a Hong Kong-listed aluminum producer with an integrated chain from bauxite mining through alumina and primary aluminum into high-end aluminum-alloy processing. AASTOCKS lists the English name as CHINAHONGQIAO.
Why are market commentary notes bullish now?
They flag low valuation, high yield, a Friday piercing-pattern candle at HK$19.02 (+5.55%), strong H1/Q3 growth, and a Morgan Stanley-linked view that yield could move toward 10% with forward P/E near 5.5x and a HK$25 rebound target.
What are the key China Hongqiao valuation numbers?
At the 26 Oct 2026 close of HK$19.50 (AASTOCKS): P/E 7.35x, TTM P/E 6.06x, P/B 1.31x, yield 8.46%, market cap HK$191.48B. RSI(14) 40.5; price below SMA10–SMA250.
What levels matter for 01378?
Resistance HK$19.70 (SMA10), HK$20.39 (SMA20), HK$21.80 (SMA50), commentary target HK$25; support HK$18.96 then HK$17.75 (52-week low).
Is this a buy after the March collapse?
That depends on your risk tolerance. The yield and multiple are attractive on the commentary’s terms, but the SMA stack and MACD are still bearish. Use levels and a stop; this is not financial advice.
Disclaimer: For information only. Based on public market commentary notes and AASTOCKS data as of 26 Oct 2026 close; data may be delayed. DimSumInsider may hold positions not stated here. Consult a licensed financial adviser. This is not financial advice. Do your own research.
Leave a Reply