Tag: Technical analysis

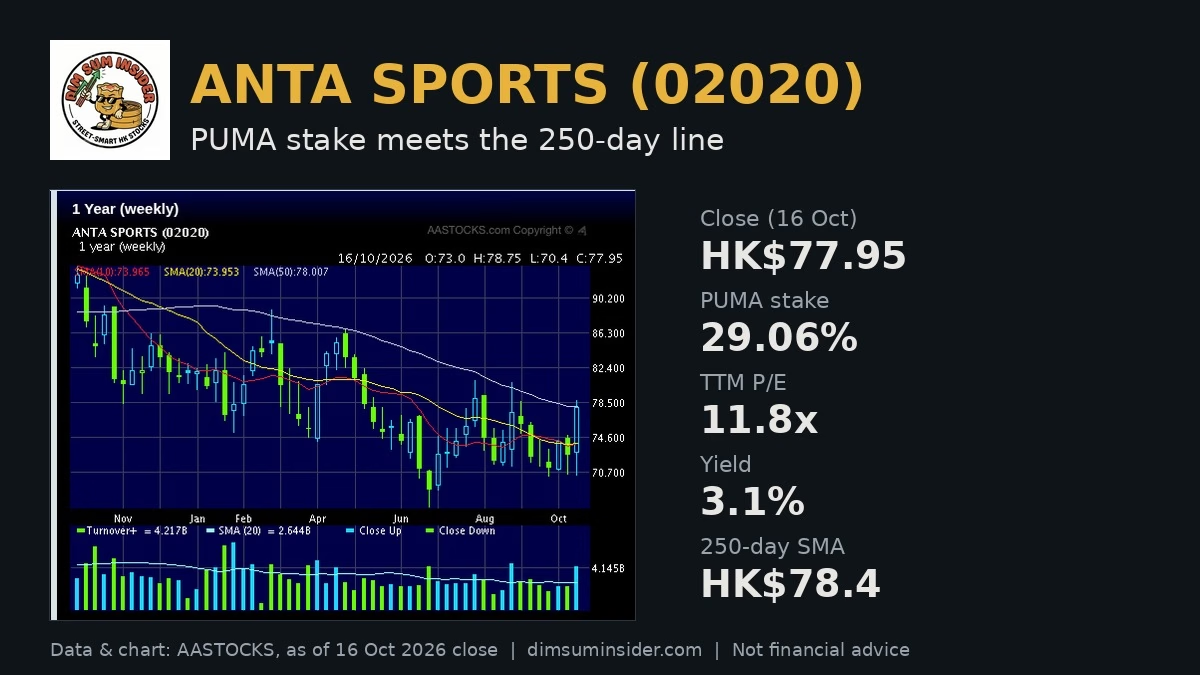
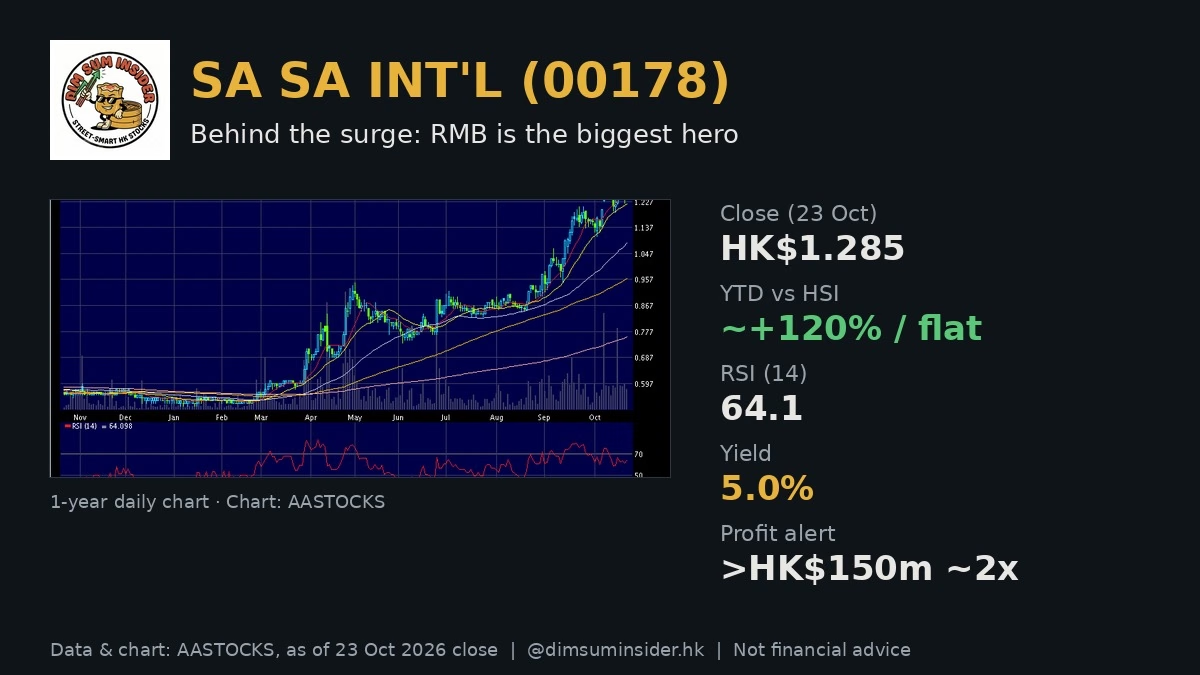
  • Sa Sa (00178): Behind the Surge, RMB Is the Biggest Hero. Up ~120% YTD vs a Flat HSI

    Sa Sa (00178): Behind the Surge, RMB Is the Biggest Hero. Up ~120% YTD vs a Flat HSI

    Sa Sa International (00178) closed Friday at HK$1.285, and the stock has roughly doubled-plus year to date while the Hang Seng Index has gone nowhere. This Sa Sa 00178 stock analysis asks the alpha question: is the hero the cosmetics shelves, or the RMB making Hong Kong look cheap again for mainland shoppers?

    Market commentary notes put the currency first. HKD/RMB has slipped from near 0.95 in April last year to near 0.85 recently — about a 15% “discount” for mainland visitors — and Golden Week sales plus a fresh profit alert are starting to show up in the numbers.
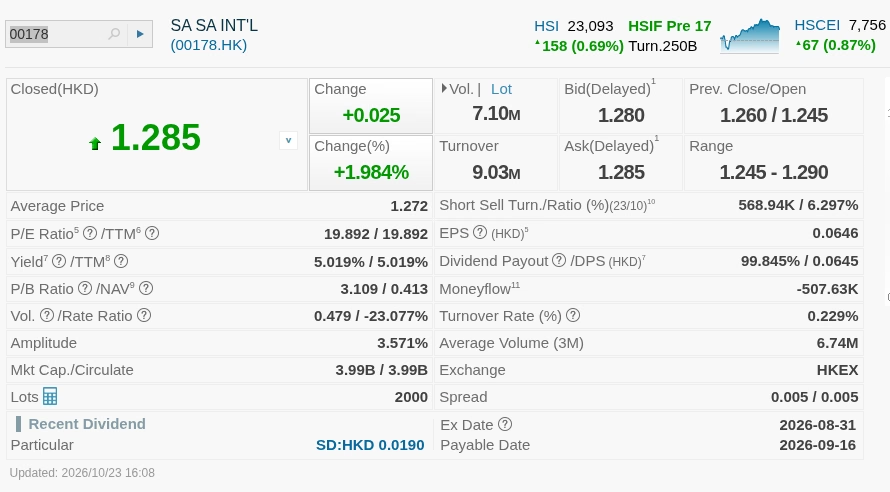
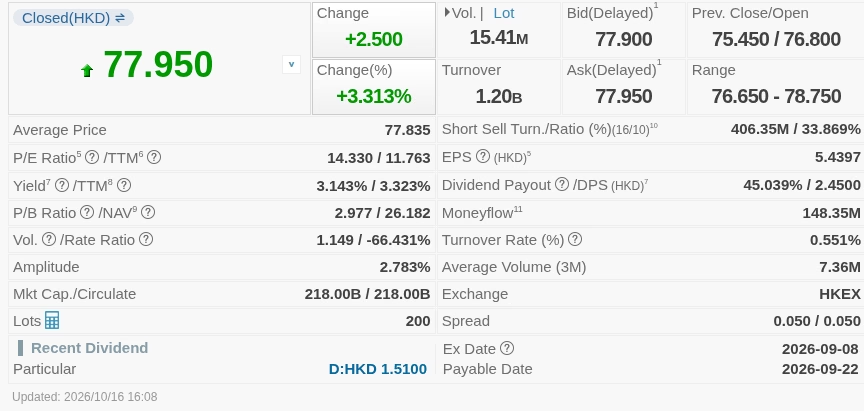
    Sa Sa International (00178) detailed quote on AASTOCKS, 23 Oct 2026 close
    Source: AASTOCKS, as of 23 Oct 2026 close

    The news in brief

    • RMB as the silent promo. Market commentary notes that queues have quietly returned on Canton Road. With HKD/RMB near 0.85 versus ~0.95 a year earlier, mainland spending in Hong Kong is effectively on sale; the 2018 pre-pandemic rate near 0.8 is the level the commentary is watching.
    • Record National Day arrivals. Official figures cited in the notes: on 1 Oct mainland visitor arrivals hit 277,000, a post-2023 reopening single-day record and above the 2018 pre-pandemic peak of 260,000.
    • Golden Week at Sa Sa. Hong Kong and Macau total sales rose over 60% YoY; same-store sales rose over 50%.
    • Positive profit alert. Sa Sa expects net profit of more than HK$150m for the six months ending September, nearly double year on year.
    • Stock vs index. Commentary chart: from a 2 Jan 2026 baseline of 0, Sa Sa is up about 1.2x (~120%) into October while the HSI is flat to slightly down.
    • Luxury weak, value cosmetics thrive. A Bloomberg report cited in the notes: in August–September, sales for 25 major luxury brands in mainland China — including Hermès, Cartier, LV and Gucci — fell by double digits YoY. Value-for-money imported cosmetics are the relative winners.
    • Peak-year context. Sa Sa’s most profitable year was 2014, with net profit above HK$900m, when HKD/RMB was also near 0.8.
    • Friday tape (AASTOCKS). Last HK$1.285 (+0.025 / +1.984%), prev 1.260, open 1.245, day 1.245–1.290. Markets are closed over the weekend; this is the 23 Oct 2026 close.

    Why RMB tourism matters for Sa Sa

    Sa Sa is a classic Hong Kong and Macau cosmetics retailer: shelves aimed at travellers and locals who want imported brands without luxury mark-ups. When the yuan strengthens against the Hong Kong dollar, every lipstick and serum looks cheaper to a mainland visitor. Market commentary notes call that a built-in 八五折 (about 15% off) at ~0.85, and they contrast it with 2018’s ~0.8 level when tourist spend was still booming.

    The visitor print on National Day backs the story: 277,000 mainland arrivals in a single day, above the 2018 peak. That footfall showed up in Sa Sa’s own Golden Week numbers — total sales +60%+ and same-store +50%+ across Hong Kong and Macau — and then in the profit alert for the half to September.

    The other side of the ledger is mainland luxury. Hermès, Cartier, LV, Gucci and peers are seeing double-digit mainland sales declines, per the Bloomberg survey of 25 brands for August–September. The cultural shift toward 性價比 (value for money), plus a negative wealth effect from soft mainland stocks and property, makes a high-street cosmetics chain a cleaner tourism proxy than a Canton Road maison.

    What still has to go right

    1. The FX stays favourable. If HKD/RMB rebounds toward 0.95, the “discount” shrinks.
    2. Visitor quality, not just volume. Golden Week was strong; sustaining same-store growth into quieter months is the test.
    3. Luxury does not steal the wallet back. A sudden rebound in mainland luxury spend would compete for the same tourist dollar.

    Sa Sa 00178 stock analysis: valuation and key numbers

    MetricSa Sa Int’l (00178)
    Last price (23 Oct close)HK$1.285
    Day change+HK$0.025 (+1.984%)
    Prev close / openHK$1.260 / HK$1.245
    Day rangeHK$1.245 – 1.290
    52-week rangeHK$0.517 – 1.350 (+130.70%)
    Market capHK$3.99B
    P/E (EPS 0.0646)19.892x
    P/B (NAV 0.413)3.109x
    Dividend yield5.019%
    SMA 10 / 20 / 501.261 / 1.219 / 1.083
    SMA 100 / 2500.961 / 0.758
    RSI 1464.10
    MACD (12,26) / signal / div0.052 / 0.056 / -0.003
    Volume / turnover7.10M / HK$9.03M
    Short-sell ratio (23/10)6.297%
    Data: AASTOCKS, updated 23 Oct 2026 16:08 HKT, market closed (Friday close; markets shut over the weekend).
    Operating / FX checkpoints (market commentary)Figure
    HKD/RMB (Apr last year → recent)~0.95 → ~0.85 (~15% discount)
    HKD/RMB 2018 / Sa Sa peak profit year 2014~0.8 / net profit >HK$900m
    Mainland arrivals 1 Oct277,000 (above 2018 peak 260,000)
    Golden Week HK+Macau sales / same-store+60%+ / +50%+ YoY
    Profit alert (6m to Sep)Net profit >HK$150m, nearly 2x YoY
    YTD vs HSI (chart from 2 Jan 2026)Sa Sa ~+120%; HSI flat/slightly down
    Source: figures cited in market commentary notes; AASTOCKS for the quote table.

    What the numbers tell us (our analysis):

    • Re-rating already happened. From the 52-week low near HK$0.52 to HK$1.285 is a more than doubling; P/E near 20x and P/B above 3x are no longer deep-value prints.
    • Yield still cushions. A 5.0% trailing yield at this price is rare for a stock that has already run ~120% YTD — but payout can cut if earnings miss.
    • Momentum is strong, not extreme. RSI(14) at 64 sits below classic overbought; price is above the 10- through 250-day SMAs in bullish stack (1.26 > 1.22 > 1.08 > 0.96 > 0.76).
    • MACD warning flicker. MACD 0.052 vs signal 0.056 (div -0.003) is a small bearish cross after a long run — watch for follow-through, not a panic print.
    • Shorts are present. A 6.3% short-sell ratio is elevated enough to matter on a down day, but not a crowded wipeout setup.

    Technical analysis: above every average, near the highs
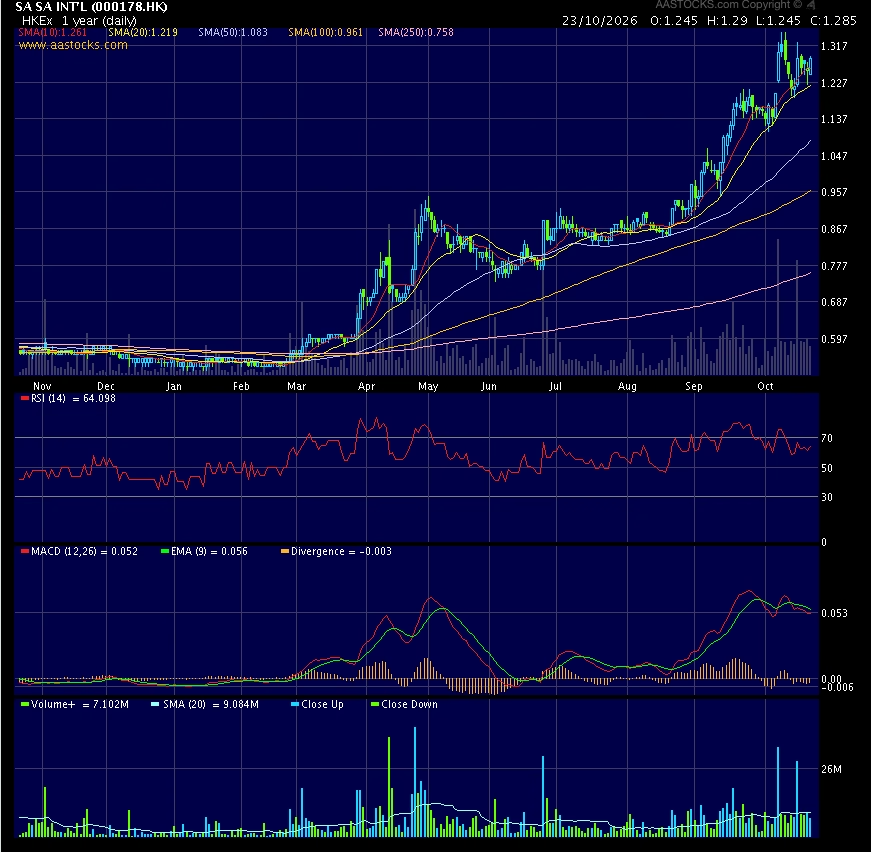
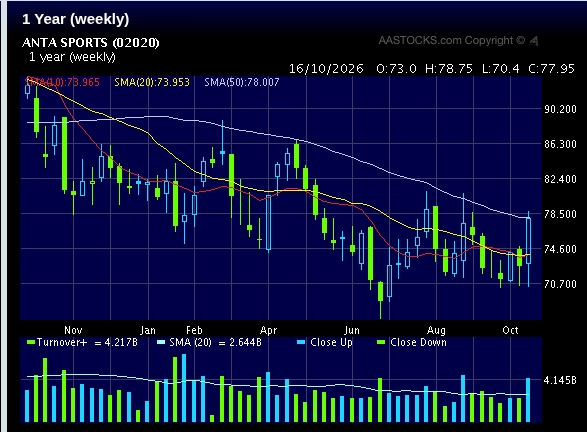
    Sa Sa International (00178) 1-year daily chart on AASTOCKS
    Source: AASTOCKS, as of 23 Oct 2026 close

    The one-year AASTOCKS chart shows a quiet base near HK$0.60 into early 2026, a breakout from March, a May peak near the mid-0.80s, summer consolidation, then a near-vertical climb from August into the HK$1.30 area. Friday’s close at HK$1.285 sits just under the 52-week high of HK$1.350.

    • Bullish SMA stack. All five listed averages slope up beneath price. First support is the 10-day SMA near HK$1.261, then the 20-day near HK$1.219.
    • RSI mid-strong. At 64, there is room before 70; the stock is trending, not frothing.
    • MACD cooling. A tiny negative histogram after a big run often precedes a pause or a shallow pullback rather than a crash — unless volume dumps on a break of the 10-day.
    • Resistance overhead. HK$1.29–1.35 is the day-high / 52-week-high band. A clean close above HK$1.35 would extend the breakout; failure here invites mean-reversion toward the 10- and 20-day lines.

    Levels: first support HK$1.261 (SMA10) and HK$1.219 (SMA20); deeper trend support HK$1.083 (SMA50). Resistance HK$1.290 (Friday high) then HK$1.350 (52-week high).

    Bull case vs bear case

    Bull case

    • Stronger RMB (~0.85 vs ~0.95) keeps giving mainland tourists a built-in discount.
    • National Day arrivals at 277,000 beat the 2018 peak; Golden Week HK+Macau sales +60%+ and same-store +50%+.
    • Profit alert: >HK$150m net for the half to September, nearly 2x YoY.
    • Luxury brands in double-digit mainland decline; value cosmetics take share.
    • 2014 peak (>HK$900m profit at ~0.8 FX) is the nostalgia upside if tourism fully normalises.

    Bear case

    • Stock already up ~120% YTD and ~131% off the 52-week low; P/E ~20x, P/B ~3.1x.
    • FX can reverse; a move back toward 0.95 removes the “discount” narrative.
    • Visitor spend quality may disappoint even if arrivals stay high (negative wealth effect).
    • MACD just slipped under its signal; short-sell ratio ~6.3% can amplify a pullback.
    • Half-year profit >HK$150m is still far below the 2014 peak — the story is recovery, not a new golden age yet.

    Levels to watch

    1. HK$1.350. 52-week high. A close above opens further upside.
    2. HK$1.290. Friday’s high; near-term supply.
    3. HK$1.261 (10-day SMA). First trend support; a close below is an early caution.
    4. HK$1.219 (20-day SMA). Momentum traders’ second line.
    5. HK$1.083 (50-day SMA). Break of the intermediate uptrend.
    6. HKD/RMB near 0.85 vs 0.95. The fundamental driver behind the tourism thesis.

    The DimSumInsider take

    Sa Sa is a clean trade on RMB + mainland footfall + value cosmetics, not a luxury recovery story. The profit alert and Golden Week sales confirm the thesis is live, but the chart has already paid a lot of it. Our approach: respect the trend above the 10- and 20-day averages, treat HK$1.35 as the breakout line, and size for FX and tourism data — not for a straight line back to 2014’s HK$900m profit year. The alpha is riding the discount while it lasts, with a hard stop if the SMA stack breaks.

    FAQ

    What does Sa Sa (00178) do?

    Sa Sa International is a Hong Kong-listed cosmetics and personal-care retailer focused on Hong Kong and Macau stores that sell imported beauty products, popular with locals and mainland tourists.

    Why has 00178 risen so much in 2026?

    Market commentary notes credit a stronger RMB (HKD/RMB ~0.95 → ~0.85), record National Day mainland arrivals, Golden Week sales up over 60% YoY, and a profit alert for more than HK$150m net profit in the six months to September.

    What are the key Sa Sa valuation numbers?

    At the 23 Oct 2026 close of HK$1.285: P/E 19.9x, P/B 3.1x, yield 5.0%, market cap HK$3.99B (AASTOCKS). RSI(14) is 64.1; the stock sits above its 10- through 250-day SMAs.

    What levels matter for Sa Sa stock?

    Support at HK$1.261 (SMA10), HK$1.219 (SMA20) and HK$1.083 (SMA50); resistance at HK$1.290 and the 52-week high of HK$1.350.

    Is this a buy after a 120% run?

    That depends on your risk tolerance. The fundamental tourism/FX story is intact, but valuation and the chart are no longer cheap. Use levels and a stop; this is not financial advice.


    Disclaimer: For information only. Based on public market commentary notes and AASTOCKS data as of 23 Oct 2026 close; data may be delayed. DimSumInsider may hold positions not stated here. Consult a licensed financial adviser. This is not financial advice. Do your own research.
  • Direct Drive (06731): Promising Robot Tech, Up 83% Since IPO. Trade It Before the Lock-Up Ends?

    Direct Drive (06731): Promising Robot Tech, Up 83% Since IPO. Trade It Before the Lock-Up Ends?

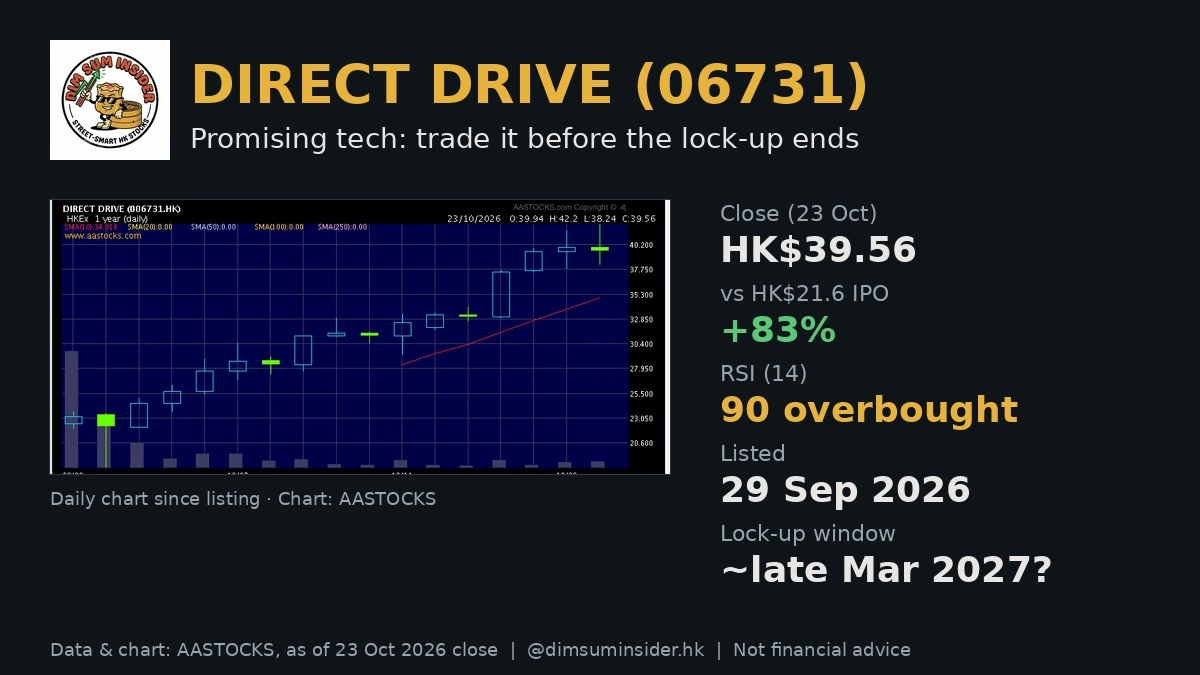
    Less than a month after listing, Direct Drive (06731), the Hong Kong robotics start-up known in Chinese as 本末科技, has run from a HK$21.6 IPO price to HK$39.56 at Friday’s close, a gain of about 83%. This Direct Drive 06731 stock analysis asks the alpha question: the technology is promising, but is this a stock to own, or a stock to trade before the lock-up ends?

    Market commentary notes take the second view: the company has real potential, the valuation is rich against revenue, and the stock can keep running at least until restricted shares are released, as long as you keep a strict stop-loss.

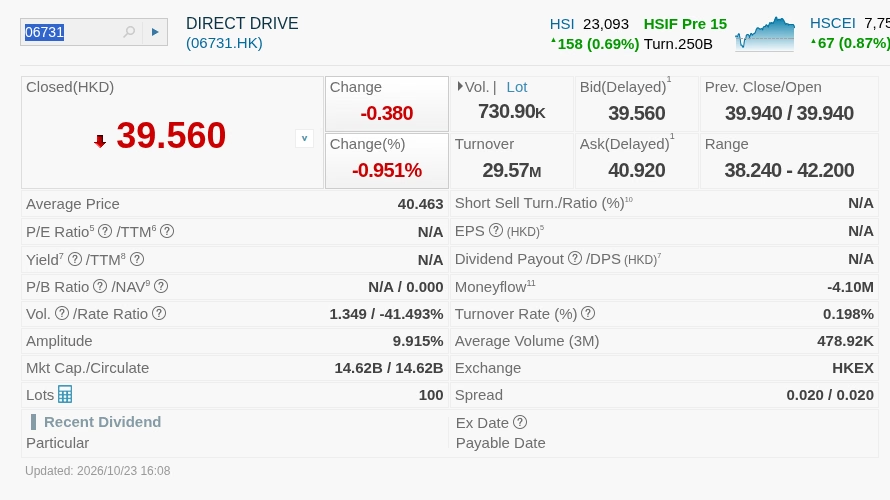
    Direct Drive (06731) detailed quote on AASTOCKS, 23 Oct 2026 close
    Source: AASTOCKS, as of 23 Oct 2026 close

    The news in brief

    • Hot IPO, calm debut. Direct Drive listed on 29 Sep 2026 after being more than 200 times oversubscribed. It opened at HK$22.48 (+4.1%) and closed day one at HK$23.20, up 7.4% on the HK$21.6 offer price (AASTOCKS). Market commentary calls that debut “fairly rational”.
    • Steady climb since. On 22 Oct the stock rose 1.1% to HK$39.94 while the broader market fell sharply. On 23 Oct it slipped 0.95% to HK$39.56 after touching an intraday HK$42.20 (AASTOCKS).
    • Pedigree. Founded by a team from the Hong Kong University of Science and Technology (HKUST), with deep involvement from Professor Li Zexiang, often called the “godfather of DJI”. Li taught DJI founder Frank Wang at HKUST and backed him early. Li also founded Googol Technology and co-founded the XbotPark robotics base in Dongguan’s Songshan Lake, which has incubated names such as Narwal, EcoFlow, Hai Robotics and CiDi (03881).
    • The idea. Founder Zhang Di, an HKUST robotics master’s graduate, removed the gearbox (reducer) from a robot drive system and drove it directly, finding big gains in noise and simplicity. The company was set up in April 2020 and closed a seed round within a month, with follow-on money from Li-controlled investors.
    • Fast growth, still loss-making. Revenue was 17.54m (2023), 79.80m (2024) and 282m (2025) yuan, and already 200m in 1H2026. Adjusted net losses were 61.22m, 61.59m, 43.25m and 27.50m over the same periods. Gross margin has held around 20%.
    • The call: pricey on sales, but likely to be traded higher before the lock-up expires. Use a strict stop.

    What Direct Drive actually does

    1. Direct-drive modules for consumer robots. The core business is direct-drive hub motors and drive modules for robot vacuums, robot lawnmowers and vacuum cleaners. With no reduction gears, the modules are quieter, more durable, smaller and use less power. Market commentary notes the company had over 60% share of China’s consumer-robot direct-drive module market in 2025 and is a core supplier to leading robot-vacuum brands Dreame and Roborock.

    2. Embodied-intelligence joints and robots. The second line is joint modules and complete machines: the Xingtian (刑天) and Tita wheel-legged robots for university research, security patrol and industrial exploration, plus integrated force-controlled direct-drive and quasi-direct-drive joint modules for humanoid and quadruped robots, including humanoid lower limbs and dexterous actuators.

    The catch: embodied-intelligence joints and machines are only about 5–7% of revenue today. More than 90% still comes from parts for consumer cleaning appliances.

    Where the growth comes from

    • Overseas lawnmowers. Market commentary sees most growth in exports and the overseas robot-lawnmower market, as Western garden mowers shift to lithium battery and smart models. Drive-wheel modules there typically carry higher gross margins than domestic robot-vacuum parts, which could improve the profit mix.
    • Quieter, thinner robots. The trend toward low-noise, slimmer vacuums and mowers keeps the “direct drive replaces gearbox” story going, but this is a maturing business.
    • Humanoids are the option value. As humanoid and wheel-legged industrial robots move into mass-production validation, high-response, high-power-density direct-drive joints are one of the key technical routes. That is what the market is paying for.

    Direct Drive 06731 stock analysis: valuation and key numbers

    MetricDirect Drive (06731)
    Last price (23 Oct close)HK$39.56
    Day change-HK$0.38 (-0.95%)
    Prev close / openHK$39.94 / HK$39.94
    Day rangeHK$38.24 – 42.20
    High / low since listingHK$41.62 / HK$18.20
    IPO price / gain sinceHK$21.6 / about +83%
    Debut day (29 Sep)Open HK$22.48 (+4.1%), close HK$23.20 (+7.4%)
    Market capHK$14.62B
    P/E / yield / P/BN/A (loss-making, newly listed)
    SMA 1034.918
    RSI 1490.25 (overbought)
    Volume / turnover730.9K / HK$29.57M
    Data: AASTOCKS, updated 23 Oct 2026 16:08 HKT, market closed. Day-one figures from AASTOCKS chart data.
    Financials (yuan, as cited)2023202420251H2026
    Revenue17.54m79.80m282m200m
    Adjusted net loss61.22m61.59m43.25m27.50m
    Gross margin~20%~20%~20%~20%
    Source: figures cited in market commentary notes; currency shown only as yuan. Check the prospectus for exact definitions.

    What the numbers tell us (our analysis):

    • Growth is real. Revenue grew about 4.5x in 2024 and 3.5x in 2025, and 1H2026 is already about 70% of full-year 2025.
    • Losses are narrowing, from about 61m a year to 27.5m in the half. But a steady ~20% gross margin is low for a “tech” multiple: this is still a components business today.
    • Rich on sales. A HK$14.62B market cap against 2025 revenue of 282m yuan is roughly 50x sales on our rough maths. Market commentary agrees it looks expensive relative to revenue, but says investors are willing to pay a premium for its specific story.

    Technical analysis: a straight line up, now overbought

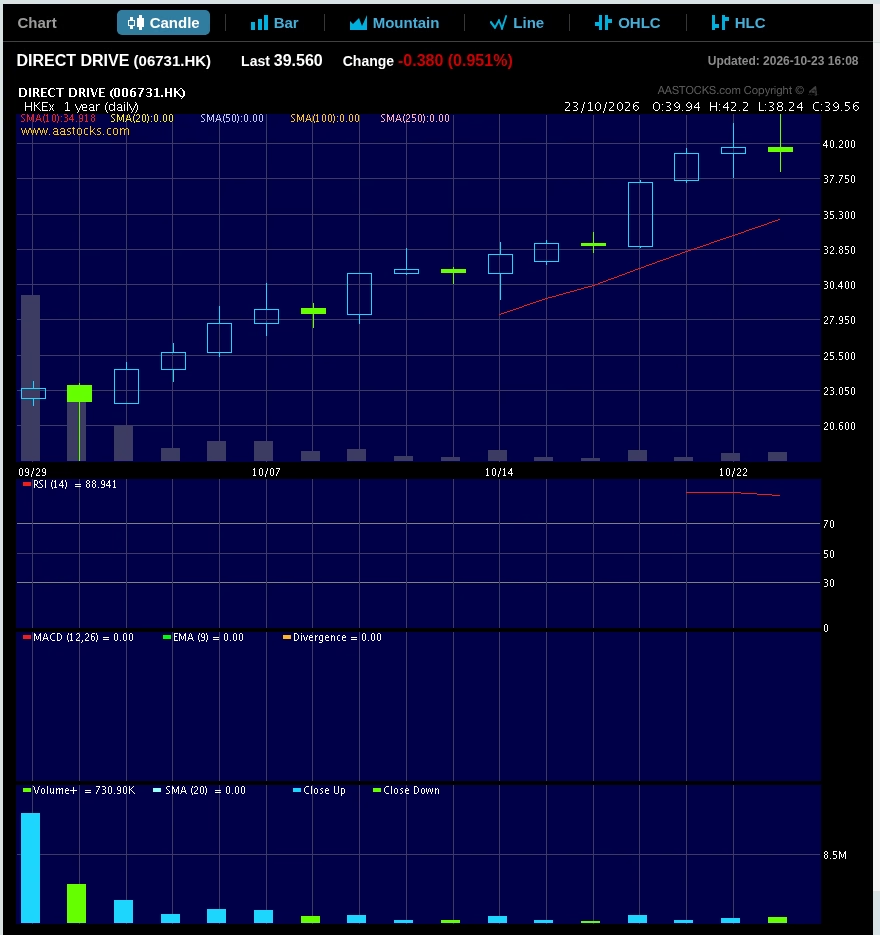
    Direct Drive (06731) daily chart since listing on AASTOCKS
    Source: AASTOCKS, as of 23 Oct 2026 close

    In about 16 trading days the chart has been almost one-way: a near-vertical staircase from the low HK$20s to the low HK$40s. Price sits well above the 10-day SMA at HK$34.92. With so little history, the 20-, 50- and longer averages and MACD are not yet meaningful.

    • Very overbought. RSI(14) at 90.25 is extreme. That does not mean it must fall, but it does mean new buyers are paying up for momentum.
    • Rejection at the highs. On Friday the stock spiked to HK$42.20 and gave most of it back to close at HK$39.56, a small warning sign.
    • Volume has faded. Turnover is far below the debut-week levels. Market commentary suggests waiting for a consolidation or a flag pattern to buy rather than chasing.

    Levels: first support is the HK$37–38 area from the 21–22 Oct candles and Friday’s HK$38.24 low, then the 10-day SMA near HK$34.9. Resistance is HK$41.6–42.2, the high since listing and Friday’s intraday spike.

    Lock-up timing: when do the restricted shares unlock?

    Market commentary’s trade is explicitly time-boxed: ride it before restricted shares are released. In Hong Kong IPOs, cornerstone investors are typically locked up for six months from listing, and controlling shareholders face at least six months under listing rules. Pre-IPO investors’ lock-ups depend on their agreements. Counting six months from the 29 Sep 2026 listing points to around late March 2027 as the first likely window.

    We have not verified Direct Drive’s exact lock-up terms, who is locked up or for how long. Check the prospectus for cornerstone, pre-IPO and controlling-shareholder lock-up dates and share counts before you use them to time a trade.

    Bull case vs bear case

    Bull case

    • Strong pedigree: HKUST, Li Zexiang and the XbotPark ecosystem that produced DJI-linked successes.
    • Over 60% share of China’s consumer-robot direct-drive module market (2025), supplying Dreame and Roborock.
    • Revenue up more than 15x from 2023 to 2025, with losses shrinking.
    • Overseas lawnmowers offer higher margins; humanoid joints give the stock a hot theme.

    Bear case

    • More than 90% of revenue still comes from consumer cleaning-appliance parts; embodied AI is only 5–7%.
    • Gross margin stuck around 20% and the company is still loss-making.
    • About 50x 2025 sales on our rough maths, and up 83% from the IPO price in under a month.
    • RSI above 90, and the lock-up expiry could bring a wave of supply.

    Levels to watch

    1. HK$41.6–42.2. A close above the post-listing high would extend the run.
    2. HK$38.24. Friday’s low; a break would signal the first real pullback.
    3. HK$34.9 (10-day SMA). The trend line for momentum traders. A close below it is a natural stop-loss trigger.
    4. Consolidation or flag. Market commentary’s preferred entry, rather than chasing.
    5. Lock-up dates. Check the prospectus; late March 2027 is the likely first window if a standard six-month lock-up applies.

    The DimSumInsider take

    Direct Drive is a genuine tech story with a great family tree, but today it is a components maker trading on a humanoid-robot dream. That is fine for a trade, not for a buy-and-forget. Our approach: wait for the RSI to cool through a consolidation, size small, keep a hard stop under the 10-day line, and plan to be lighter well ahead of the lock-up expiry. The alpha is riding the theme, not marrying it.

    FAQ

    What does Direct Drive (06731) do?

    It makes direct-drive motors and drive modules for robot vacuums, robot lawnmowers and vacuum cleaners, plus joint modules and wheel-legged robots (Xingtian, Tita) for embodied-intelligence and humanoid robotics.

    How has 06731 done since its IPO?

    It was priced at HK$21.6, listed on 29 Sep 2026, closed day one at HK$23.20 (+7.4%) and closed at HK$39.56 on 23 Oct 2026, up about 83% (AASTOCKS).

    Is Direct Drive profitable?

    No. Adjusted net losses were 61.22m, 61.59m and 43.25m yuan in 2023–2025 and 27.50m in 1H2026, while revenue grew to 282m in 2025 and 200m in 1H2026.

    When does the Direct Drive lock-up expire?

    A standard six-month lock-up from the 29 Sep 2026 listing would end around late March 2027. Check the prospectus for the exact dates and which shareholders are covered.

    What are the key technical levels?

    Support at HK$38.24 and the 10-day SMA near HK$34.9; resistance at HK$41.6–42.2. RSI(14) is about 90, deeply overbought.


    Disclaimer: For information only. Based on public market commentary notes and AASTOCKS data as of 23 Oct 2026 close; data may be delayed. DimSumInsider may hold positions not stated here. Consult a licensed financial adviser. This is not financial advice. Do your own research.
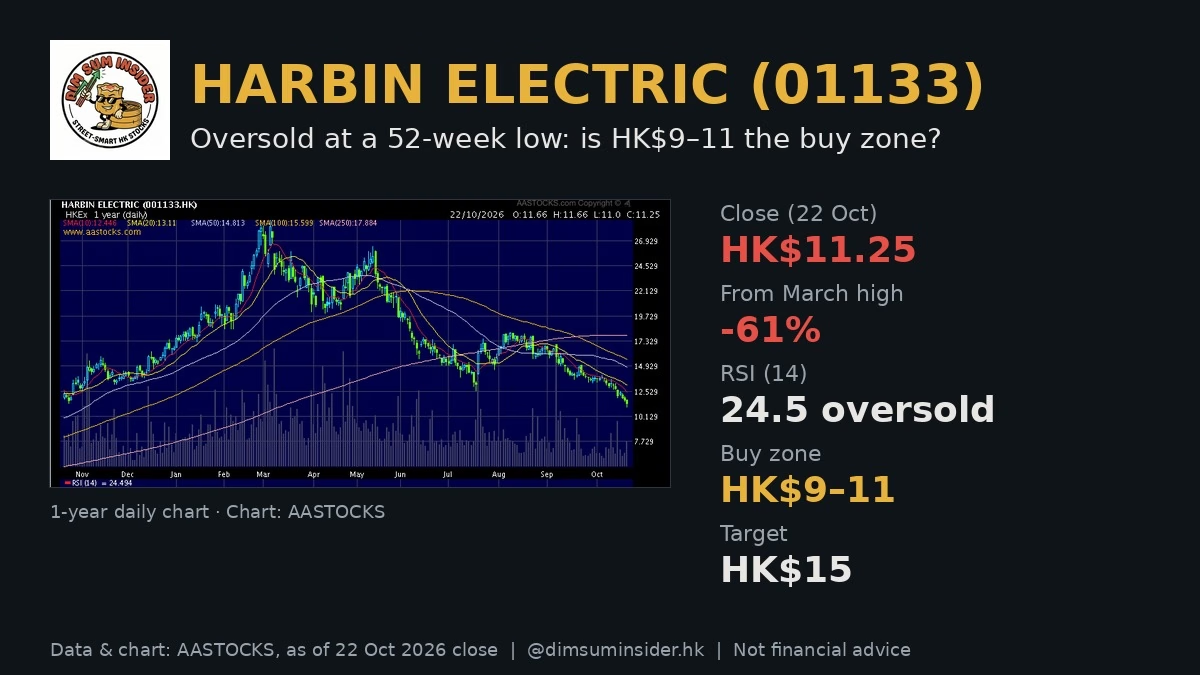
  • Harbin Electric (01133): Profits Up 63%, Stock Down 61%. Is the HK$9–11 Buy Zone Here?

    Harbin Electric (01133): Profits Up 63%, Stock Down 61%. Is the HK$9–11 Buy Zone Here?

    Seven straight months of selling have taken Harbin Electric (01133) from a record HK$28.88 in March to HK$11.25 at Thursday’s close, a new 52-week low and a drop of about 61%. This Harbin Electric 01133 stock analysis asks the alpha question: profits are still growing at double-digit pace, so has the sell-off gone too far, and is the market handing out a high-yield power-equipment name at a single-digit P/E?

    Market commentary notes argue yes: after the valuation reset, HEC looks attractive, with an accumulation zone of HK$9–11 and a target of HK$15. Thursday’s slide below the HK$11.63 close cited in that commentary means the stock is now knocking on the door of that zone.

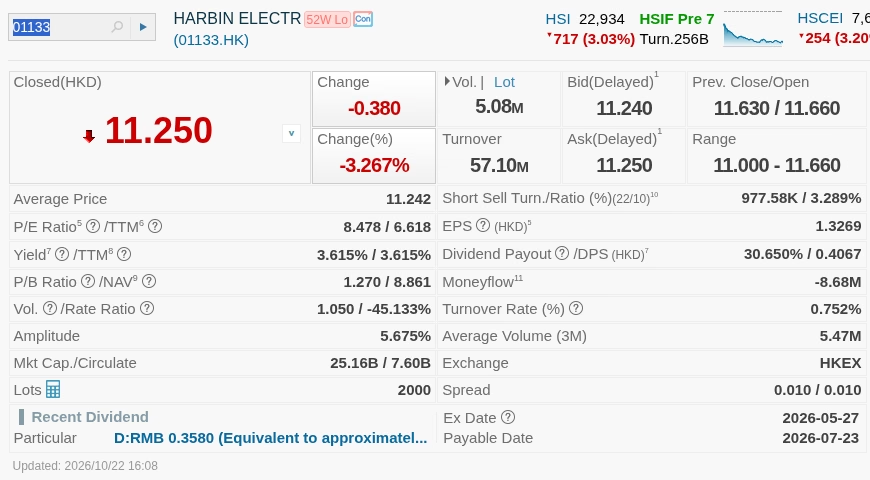
    Harbin Electric (01133) detailed quote on AASTOCKS, 21 Oct 2026 close
    Source: AASTOCKS, as of 21 Oct 2026 close

    The news in brief

    • Record high to 52-week low. HEC hit a record HK$28.88 in March and then fell for seven straight months to HK$11.63 on 21 Oct. On 22 Oct it lost another 3.3% to HK$11.25, a new 52-week low (AASTOCKS).
    • Weak tape. The Hang Seng Index opened higher and closed lower on 21 Oct, dragged by weak US tech, and sentiment in Hong Kong remains fragile.
    • Earnings still climbing. Market commentary notes that HEC turned around from 2022, with net profit rising sharply each year since on a low base. For 1H2026, revenue rose 10.3% to about RMB24.8bn, net profit jumped 63.5% to about RMB1.718bn, and gross margin improved 2.95 points to about 15%.
    • Why the stock fell anyway: the market expects coal-power equipment orders to peak and roll over as China sharply cuts new coal-power approvals (“good news fully priced”), peer Dongfang Electric (01072) had targets cut, and brokers trimmed HEC targets from about HK$32 to about HK$30 while lowering EPS forecasts.
    • Valuation was stretched at the top. At the March high, HEC traded on roughly 22x trailing earnings. Today AASTOCKS shows a P/E of 8.5x and a TTM P/E of 6.6x.
    • Order book is deep. Total backlog is estimated at over RMB100bn. 1H2026 new orders were RMB36.04bn (+1.35%), with new-type power equipment orders of RMB27.1bn (+41.19%), per company interim data cited in the commentary.
    • The call: forward yield of about 5.2%, accumulate at HK$9–11, target HK$15.

    Fundamentals: profits up, stock down

    This is the classic “results beat, stock sinks” setup. The 1H numbers are good: double-digit sales growth, profit up nearly two-thirds and a near three-point margin expansion. The problem is not the last six months, it is the next three years. China has sharply cut new coal-power approvals, and coal-fired units have been a key driver of the order boom across HEC and Dongfang Electric. When investors think orders have peaked, they stop paying for growth even while reported earnings keep rising.

    The bull counter is the order book. A backlog estimated at more than RMB100bn, against roughly RMB50bn of annualised revenue on our maths from the 1H run-rate, gives about two years of work already in hand. New orders held steady at RMB36.04bn in the half, and the new-type power equipment category grew 41%, which suggests the mix is shifting rather than collapsing.

    Management has also been selective. Market commentary notes that HEC optimised its order strategy, delivering or releasing low-margin legacy contracts, while higher-margin orders signed in recent years should support relatively high growth for the next three years. That is consistent with the 2.95-point gross-margin gain.

    Why the de-rating happened

    1. Coal-power peak fears. Fewer new approvals means fewer future boiler and turbine orders.
    2. Sector read-across. Target cuts at Dongfang Electric (01072) hit the whole group.
    3. Starting valuation. A run to HK$28.88 at about 22x trailing P/E left no room for disappointment. Broker targets slipped from about HK$32 to about HK$30, and the stock fell anyway.

    Harbin Electric 01133 stock analysis: valuation and key numbers

    MetricHarbin Electric (01133)
    Last price (22 Oct close)HK$11.25
    Day change-HK$0.38 (-3.27%)
    Prev close / openHK$11.63 / HK$11.66
    Day rangeHK$11.00 – 11.66
    52-week rangeHK$11.33 – 28.88 (new 52-week low)
    Market cap (H-share circulating)HK$25.16B (HK$7.60B)
    P/E (EPS 1.3269)8.48x
    TTM P/E6.62x
    P/B (NAV/share 8.861)1.27x
    Dividend yield / DPS / payout3.62% / 0.4067 / 30.65%
    SMA 10 / 20 / 5012.446 / 13.110 / 14.813
    SMA 100 / 25015.599 / 17.884
    RSI 10 / 14 / 2020.30 / 24.49 / 29.49 (oversold)
    MACD (12,26) / signal / divergence-0.850 / -0.719 / -0.13
    Volume / turnover5.08M / HK$57.10M
    Short selling ratio (half-day)3.29%
    Data: AASTOCKS, updated 22 Oct 2026 16:08 HKT, market closed.

    What the numbers tell us (our analysis):

    • Single-digit P/E on growing profits. A TTM P/E of 6.6x below the 8.5x headline P/E means trailing earnings are already running above base-year EPS: the 1H profit jump is in the numbers. Market commentary estimates the P/E falls to about 5.8x on this year’s earnings if full-year profit grows around 50%.
    • Yield is the floor. The trailing yield is 3.6% on a ~30% payout. Market commentary notes that if the payout is maintained, the forward yield is about 5.2% at HK$11.63; at HK$11.25 that edges higher on our maths.
    • Near book value. At 1.27x NAV of HK$8.86, the bottom of the HK$9–11 buy zone is close to book.
    • HK$15 is upside, not a moonshot. The target is about 33% above Thursday’s close and sits roughly at the 50- to 100-day moving averages, a sensible mean-reversion level.
    • Shorts are not the story. A 3.3% short ratio says this is long holders exiting, not a crowded short.

    Technical analysis: oversold, but still falling

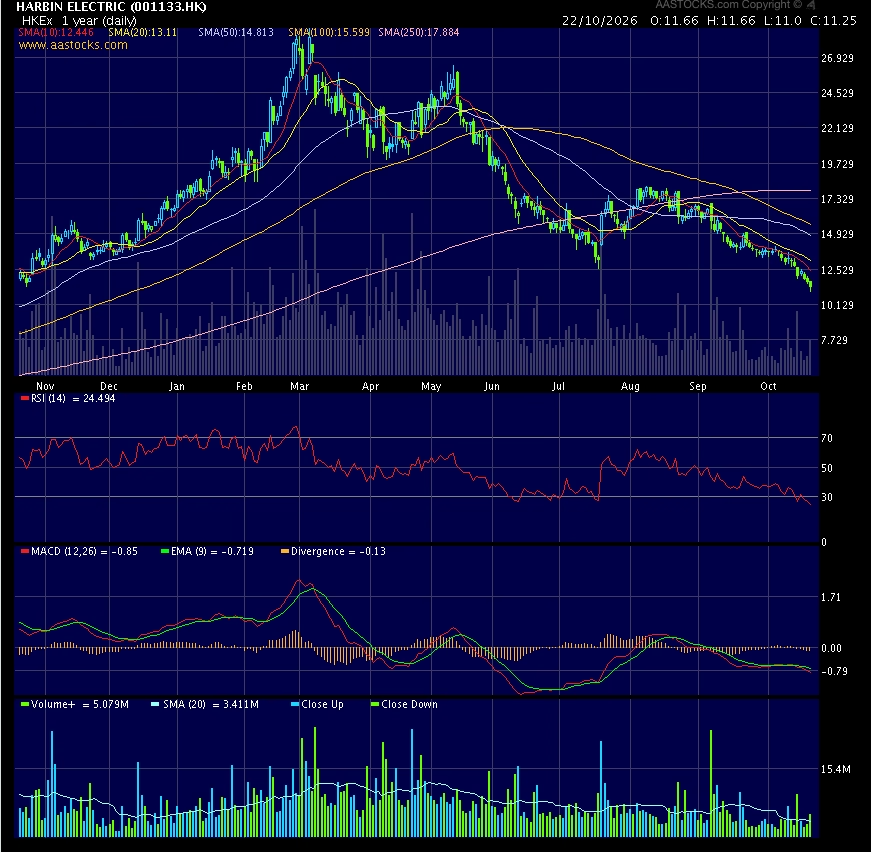
    Harbin Electric (01133) 1-year daily chart on AASTOCKS
    Chart: AASTOCKS, 1-year daily, as of 21 Oct 2026

    The one-year chart is a round trip: a steep rally into the March record high, then a seven-month staircase down. Price is below all five listed AASTOCKS SMAs (10, 20, 50, 100 and 250 days), stacked in bearish order from 12.4 up to 17.9. That is a textbook downtrend.

    Momentum is stretched to the downside:

    • Deeply oversold. RSI(10) at 20.3 and RSI(14) at 24.5 are well below 30.
    • MACD not turning yet. MACD at -0.85 is below its -0.719 signal line, a -0.13 divergence. No bullish cross yet.
    • Fresh low on a down day. The intraday low of HK$11.00 undercut the prior 52-week low of HK$11.33. Bulls need that to be the flush.

    Levels: support at HK$11.00 (Thursday’s low), then HK$9–11 (the commentary’s accumulation zone, near book value). First resistance is the 10-day SMA at HK$12.45, then the 20-day at HK$13.11 and the HK$14.8–15.6 band of the 50- and 100-day lines, which lines up with the HK$15 target.

    Bull case vs bear case

    Bull case

    • 1H net profit +63.5% and gross margin +2.95 points: earnings momentum is real.
    • Order book estimated at over RMB100bn, with high-margin orders seen supporting growth for three years.
    • Forward yield about 5.2% if the ~30% payout holds, at a P/E of 6.6x TTM.
    • RSI in the 20s and a 61% drawdown: a lot of bad news is already in the price.

    Bear case

    • China’s sharp cut in coal-power approvals could make 2026 the order peak.
    • Broker EPS cuts and Dongfang Electric target cuts show the sector narrative has turned.
    • Price is below every moving average and MACD has not crossed up: no confirmation of a bottom.
    • A weak Hang Seng tape driven by US tech can keep pressure on any rebound.

    Levels to watch

    1. HK$11.00 on a closing basis. Thursday’s intraday low and the top of the buy zone.
    2. HK$9–11 accumulation zone. Market commentary’s staged buy range, near book value.
    3. HK$12.45 / 13.11. Reclaiming the 10- and 20-day SMAs would be the first sign the slide is over.
    4. HK$15 target. Coincides with the 50- and 100-day SMA band.
    5. New-order data. Watch whether new-type power equipment orders keep offsetting coal-power weakness.

    The DimSumInsider take

    Harbin Electric is a good-results, bad-chart stock. Profits are growing fast, the backlog is deep and the yield case is building, but the market is pricing a coal-power order cliff. At 6.6x trailing earnings, 1.27x book and a forward yield around 5%, a lot of that fear is already in the price. Our approach: the HK$9–11 zone is where you scale in, not chase, and you want the 10-day line back before adding size. The alpha is collecting yield while the market argues about 2027 orders.

    FAQ

    Why has Harbin Electric (01133) fallen so much?

    The market expects coal-power equipment orders to peak as China sharply cuts new coal-power approvals, peer Dongfang Electric had targets cut, and brokers lowered HEC targets and EPS forecasts. The stock fell from a HK$28.88 record in March to HK$11.25 on 22 Oct 2026 (AASTOCKS).

    How did Harbin Electric do in 1H2026?

    Revenue rose 10.3% to about RMB24.8bn, net profit rose 63.5% to about RMB1.718bn and gross margin improved 2.95 points to about 15%.

    What is the target price for 01133?

    Market commentary sets a HK$15 target with an accumulation zone of HK$9–11.

    What is Harbin Electric’s dividend yield?

    AASTOCKS shows a trailing yield of 3.62% on a 30.65% payout. Market commentary estimates a forward yield of about 5.2% if the payout is maintained.

    What are the key technical levels?

    Support at HK$11.00 and the HK$9–11 zone; resistance at HK$12.45 (10-day SMA), HK$13.11 (20-day) and HK$14.8–15.6 (50- and 100-day). RSI(14) is 24.5, oversold.


    Disclaimer: For information only. Based on public market commentary notes, company interim data and AASTOCKS data as of 22 Oct 2026 close; data may be delayed. DimSumInsider may hold positions not stated here. Consult a licensed financial adviser. This is not financial advice. Do your own research.
  • BYD (01211): Bad News Priced In? The Double-Bottom Test at HK$71

    BYD (01211): Bad News Priced In? The Double-Bottom Test at HK$71

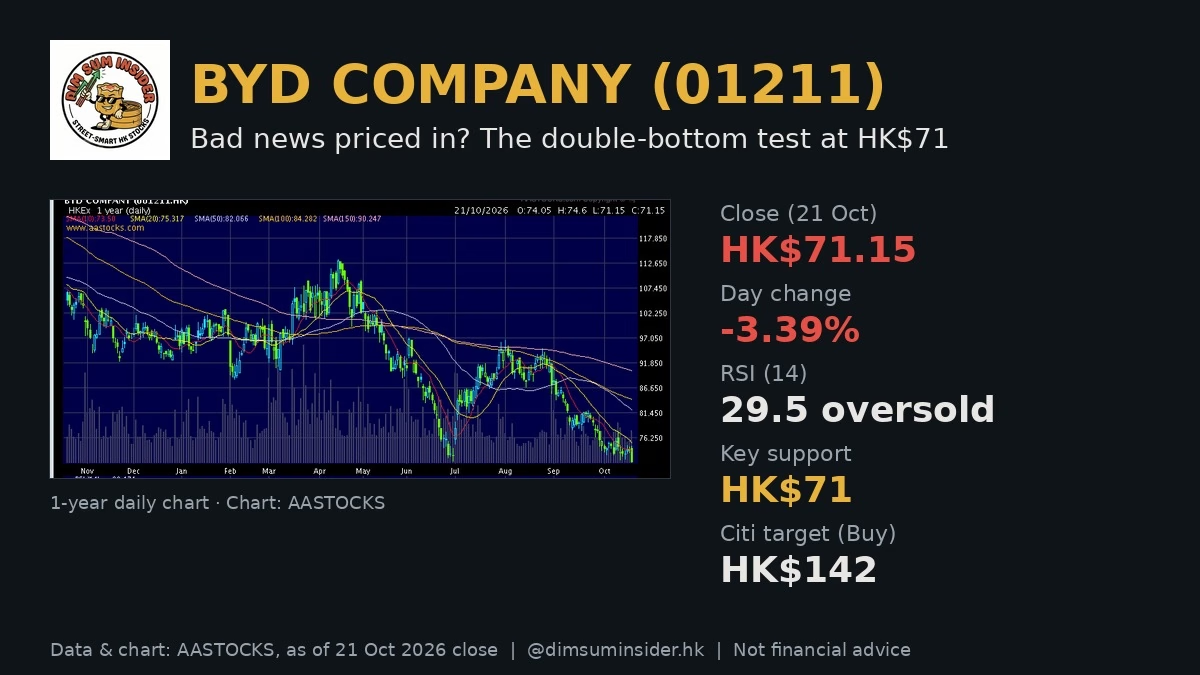
    China EV stocks have been the market’s favourite punching bag all autumn, and on Wednesday the selling got loud: CATL dropped more than 11%, the Hang Seng Tech Index hit a two-year-plus low, and BYD (01211) closed down 3.4% at HK$71.15, a fresh 52-week-low zone. This BYD 01211 stock analysis asks the contrarian question: is the bad news finally priced in, and is a double bottom forming at HK$71?

    The bear list is well known: a domestic price war, slowing China growth and European restrictions on Chinese EVs. The bull reply from market commentary notes is that all three are now in the price, the European overhang has been settled, and Citi still says Buy with a HK$142 target. Q3 results land at the end of October.

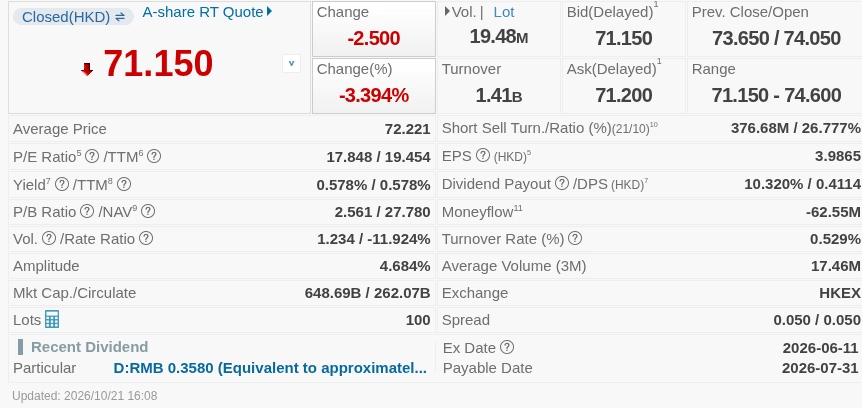
    BYD (01211) detailed quote on AASTOCKS, 21 Oct 2026 close
    Source: AASTOCKS, as of 21 Oct 2026 close

    The news in brief

    • Sector mood is ugly. On 21 Oct the Hang Seng Index reversed to close down 215 points, HSTECH hit a 2+ year low and CATL plunged over 11%. On 20 Oct four Chinese authorities held a symposium with more than 30 automakers on design and R&D testing management, and on 16 Oct Citi research flagged that China’s battery supply-chain peak season was weaker than expected.
    • Why NEV stocks de-rated: fierce domestic competition means investors now value the sector like a mature industry growing at single-digit to low-double-digit rates, and news of European curbs on Chinese EVs kept surfacing.
    • Europe overhang cleared: the EU and China agreed a minimum-price arrangement on EV tariffs from 1 Dec 2026. Imports of China-made hybrids (HEV and PHEV) are capped at 350,000 units a year for four years, and Chinese brands assembling locally are exempt.
    • Local capacity: BYD’s Szeged, Hungary plant is expected to start production at the end of 2026 with planned capacity of 300,000 units.
    • 1H2026 results: revenue about RMB344.8bn (-7.1% YoY), net profit about RMB12.3bn (-20.5%), but gross profit up 2.81% to RMB64.989bn and gross margin up 0.84pp to 18.85%. Operating cash inflow rose 17.3% to RMB37.335bn.
    • Overseas engine: 1H overseas car sales of 792,000 units (+67.8%) and overseas revenue of RMB181.3bn.
    • Citi: expects Q3 net profit of RMB12.95bn (excluding FX and BYD Electronic (00285) contribution), maintains Buy with an H-share target of HK$142.

    Fundamentals: shrinking at home, sprinting abroad

    The 1H numbers look bad on the headline and better underneath. Revenue fell 7.1% and net profit 20.5% as the domestic price war ate into per-car profit. Yet gross profit actually rose 2.81% and gross margin improved 0.84pp to 18.85%. The reason is mix: overseas cars earn clearly higher net margin per vehicle than domestic ones, and the overseas share of both volume and revenue keeps climbing.

    The overseas numbers are now the core of the story. 792,000 cars sold abroad in the half (+67.8%) and RMB181.3bn of overseas revenue, which is more than half of the RMB344.8bn group total on our maths. Plants in Thailand and Brazil are ramping and Hungary is next.

    At home, the RMB100k-200k mainstream band is a knife fight with Geely (00175), Changan and the new EV makers. BYD’s battery vertical integration and technology upgrades mean its margin decline is still milder than most rivals’. Volume support comes from the 5th-generation DM hybrid technology and trade-in subsidies; domestically the goal is to defend share, while growth comes from Europe, Southeast Asia and Latin America.

    Two quality flags worth noting:

    • Cash is better than profit. Operating cash inflow up 17.3% while net profit fell 20.5% suggests earnings quality is holding up.
    • Inventory discipline. After earlier pushes of stock into dealers, the factory has adjusted production to avoid squeezing dealer cash flow. Good for the channel, but it caps near-term volume.

    Europe: the overhang that just got a ceiling

    Markets hate open-ended risk. The EU-China deal turns an unknown into a number: a 350,000-unit annual quota for China-made hybrids for four years, effective 1 Dec 2026, with local assembly exempt. That is exactly why Szeged matters: 300,000 units of EU-made capacity from the end of 2026 sits outside the quota.

    Citi’s view is that FY2027 exports to Western Europe have limited downside: even with a hybrid cap, China’s EV exports to Western Europe should stay roughly flat, helped by local capacity rising to 400,000 units.

    Citi’s three reasons for a valuation floor

    1. Policy uncertainty removed. The EU-China minimum-price and hybrid arrangement gives short-term relief.
    2. The policy overhang is out. The two main headwinds that weighed on sentiment have now been announced rather than feared.
    3. Weak Q4 2026 China demand is already expected and largely priced in.

    Citi’s FY2027 assumptions: China NEV retail flat and ICE retail -24%; NEV exports +45% and ICE exports +10%; passenger vehicle wholesale +5.9%, against a market consensus of about -5%. Citi also argues that strong free cash flow could trigger short covering.

    BYD 01211 stock analysis: valuation and key numbers

    MetricBYD (01211)
    Last price (21 Oct close)HK$71.15
    Day change-HK$2.50 (-3.39%)
    Prev close / openHK$73.65 / HK$74.05
    Day rangeHK$71.15 – 74.60
    52-week rangeHK$71.40 – 113.40
    52-week performance-31.52%
    Market cap (H-share circulating)HK$648.69B (HK$262.07B)
    P/E (EPS HK$3.9865)17.85x
    TTM P/E19.45x
    P/B (NAV/share HK$27.780)2.56x
    Dividend yield / DPS / payout0.58% / HK$0.4114 / 10.3%
    SMA 10 / 20 / 5073.500 / 75.317 / 82.066
    SMA 100 / 150 / 25084.282 / 90.247 / 93.324
    RSI (14)29.5 (oversold)
    MACD / signal / histogram-2.636 / -2.754 / +0.118
    Volume vs 3M average19.48M vs 17.46M
    TurnoverHK$1.41B
    Short selling share of turnover26.8% (HK$376.68M)
    Moneyflow-HK$62.55M
    Data: AASTOCKS, as of 21 Oct 2026 close.

    What the numbers tell us (our analysis):

    • The P/E gap points to falling earnings. A TTM P/E of 19.5x above the 17.8x headline P/E means trailing earnings (about HK$3.66 a share, working back from the price) are below base-year EPS of HK$3.99. That is the 1H profit decline showing up. Q3 needs to show the slide is flattening.
    • Not a yield play. A 0.58% yield on a 10% payout says BYD is reinvesting, not distributing. The last dividend was RMB0.3580, ex on 11 Jun and paid on 31 Jul.
    • Book value as a floor reference. At 2.56x NAV of HK$27.78, BYD is far from a balance-sheet bargain; the floor case rests on cash flow and overseas growth.
    • Citi’s target is a long way off. HK$142 is roughly double the HK$71.15 close. Treat it as a sign of how far sentiment has swung, not a 12-month promise.

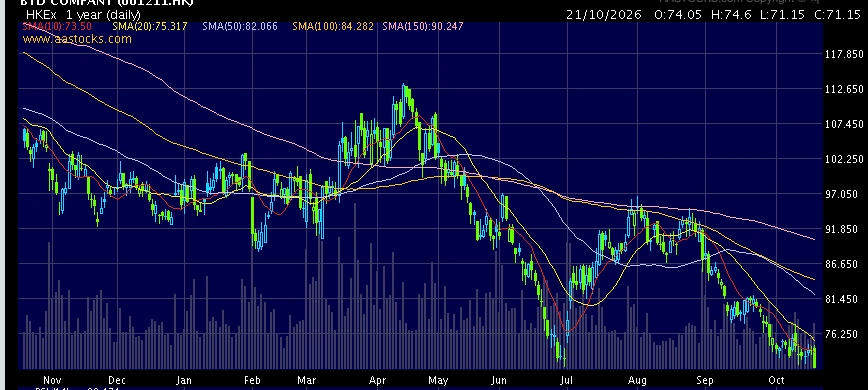
    Technical analysis: the double-bottom test at HK$71

    BYD (01211) 1-year daily chart on AASTOCKS
    Chart: AASTOCKS, 1-year daily, as of 21 Oct 2026

    The one-year daily chart is a clean downtrend: from the HK$113.40 peak in April, through a July low in the low HK$70s, a rebound into the mid-HK$90s in August, then a steady slide back down through September and October. Price is now sitting right on the July lows. That is the double-bottom setup market commentary is pointing to.

    The bear case is in the moving averages. The stock is below all six AASTOCKS SMAs (10, 20, 50, 100, 150 and 250 days), and they are stacked in bearish order from 73.5 up to 93.3. Every rally has a ceiling right above it.

    The bull case is in the momentum:

    • Oversold. RSI(14) at 29.5 is below 30 for the first time in a while.
    • MACD turning. MACD at -2.636 has just crossed above its -2.754 signal line, a small +0.118 histogram: early, not confirmed.
    • Volume tells you who is selling. 19.48M shares versus a 17.46M average on a down day, plus negative moneyflow, means the low is still being tested. Short selling at 26.8% of turnover is high, which is also the fuel for any short-covering pop Citi expects.

    Levels: support at HK$71 (the 52-week-low area, with the AASTOCKS 52-week low printed at HK$71.40 and Wednesday’s close at HK$71.15). First resistance is the HK$73.5–75.3 zone of the 10- and 20-day SMAs, then HK$82 (50-day). A double bottom only counts if HK$71 holds on a closing basis and price reclaims the 20-day line. We made the same point about the 250-day “gatekeeper” line in our ANTA Sports (02020) stock analysis: in this tape you wait for the chart to confirm the story.

    Risks

    • Double bottom fails. A decisive close below HK$71 would turn the support into a breakdown, with no recent chart support underneath.
    • Price war at home. Revenue -7.1% and profit -20.5% show the domestic squeeze is real; Q3 could disappoint.
    • Sector contagion. CATL’s 11% plunge, HSTECH at a 2+ year low and Citi’s weak battery peak-season note show the whole supply chain is under pressure.
    • Regulation. The 20 Oct symposium on design and R&D testing management signals tighter oversight of automakers.
    • Europe execution. The 350,000-unit hybrid quota limits exports, and Szeged has to ramp on time to offset it.
    • Heavy short selling. More than a quarter of turnover is short selling; short covering can help, but shorts are still pressing.

    What to watch

    1. Q3 results at end-October. Compare with Citi’s RMB12.95bn net profit estimate (ex-FX and BYD Electronic).
    2. HK$71 on a closing basis. Hold it and the double-bottom case lives; lose it and stand aside.
    3. Reclaiming HK$73.5–75.3. A close back above the 10- and 20-day SMAs would be the first confirmation.
    4. Overseas sales and margins. The overseas share is the whole bull case; watch monthly export numbers.
    5. Szeged start-up timing ahead of the 1 Dec 2026 EU arrangement.

    The DimSumInsider take

    BYD is a tale of two businesses: a domestic franchise grinding through a price war and an overseas business growing almost 70% with better margins. The European overhang now has a ceiling, Hungary is close, cash flow is up and Citi says Buy at HK$142. The chart, though, is still in a downtrend with every moving average overhead. Our approach: HK$71 is the line. Oversold RSI and a fresh MACD cross give the double bottom a real chance, especially with heavy short interest into Q3 results, but we would want a close back above HK$75 before calling the bottom. The alpha here is buying confirmation near support, not catching a falling knife in a sector that is still being sold. For more HK rotation ideas, see our Kingsoft (03888) stock analysis.

    FAQ

    Why did BYD (01211) shares fall to a 52-week low?

    Domestic price competition, slowing China growth, worries about European restrictions and sector-wide selling (CATL fell more than 11% on 21 Oct) pushed BYD down 3.4% to HK$71.15 (AASTOCKS, 21 Oct 2026 close).

    What is the EU-China deal on Chinese EVs?

    A minimum-price arrangement on EV tariffs from 1 Dec 2026, with imports of China-made hybrids (HEV and PHEV) capped at 350,000 units a year for four years. Chinese brands assembling locally are exempt.

    What is Citi’s target price for BYD?

    Citi maintains Buy with an H-share target of HK$142 and expects Q3 net profit of RMB12.95bn, excluding FX and BYD Electronic (00285).

    What are the key technical levels for 01211?

    Support at about HK$71 (52-week-low area) and first resistance at HK$73.5–75.3 (10- and 20-day SMAs). RSI(14) is 29.5, in oversold territory.

    When does BYD report Q3 2026 results?

    At the end of October 2026.


    Disclaimer: For information only. Based on public market commentary notes, broker views and AASTOCKS data as of 21 Oct 2026 close; data may be delayed. DimSumInsider may hold positions not stated here. Consult a licensed financial adviser. This is not financial advice. Do your own research.
  • ANTA Sports (02020): PUMA Stake Meets the 250-Day Line

    ANTA Sports (02020): PUMA Stake Meets the 250-Day Line

    Most of the market filed China sportswear under “weak consumer, skip it” months ago. The tape is starting to argue back. ANTA Sports (02020) has just become PUMA’s largest shareholder and the stock has climbed for several straight sessions. This ANTA Sports 02020 stock analysis asks one question: is this a real re-rating, or a rally running into a wall?

    It closed Friday 16 Oct at HK$77.95, up 3.3% on more than twice its 3-month average volume. That left it just under the one line that matters on the chart: the 250-day moving average near HK$78.4.

    ANTA Sports (02020) detailed quote on AASTOCKS, 16 Oct 2026 close
    Source: AASTOCKS, as of 16 Oct 2026 close

    The news in brief

    • On 7 Oct 2026 ANTA announced it had completed the purchase of about 29.06% of PUMA for EUR1.506bn, making it the German brand’s largest shareholder.
    • PUMA joins a stable that already includes FILA, SALOMON, DESCENTE, JACK WOLFSKIN and ARC’TERYX alongside the core ANTA brand, which competes head-on with NIKE and ADIDAS. The deal is a milestone for ANTA’s “single focus, multi-brand, globalisation” strategy.
    • The bull case centres on China: PUMA’s Greater China sales are only about 7% of its total, against 17% to 30% for global sportswear peers.
    • Macro backdrop: China’s September CPI rose 0.9% year on year, near a three-month high, but on raw material and energy costs rather than a demand recovery.
    • Street chatter’s technical call: the stock has risen for days, a break of the 250-day bull/bear line would open further upside, and dips are for accumulating.
    • Goldman Sachs cut its ANTA target price to HK$105 on 15 Oct and kept its Buy rating (AASTOCKS news headline).
    • Diary note: the Hong Kong market is closed on Monday 19 Oct 2026 for a holiday and reopens Tuesday 20 Oct.

    Why PUMA matters: the multi-brand playbook

    ANTA’s pitch has never been “one brand to beat NIKE”. It is a portfolio: a mass-market home brand, premium and outdoor labels on top, and a group platform that runs retail, supply chain and distribution across all of them. PUMA adds a genuinely global brand to that machine, which is why the strategy is summed up as “single focus, multi-brand, globalisation”.

    The China numbers are the heart of the trade. PUMA earns about 7% of its sales in Greater China, while global sportswear peers sit at 17% to 30%. Market commentary argues that ANTA’s turnaround capability and its DTC (direct-to-consumer) model are exactly the tools needed to integrate PUMA into the mainland market and lift its performance there.

    Our read: the gap is the opportunity, but we would not put a number on it until management does. Two points keep the bull case honest:

    • 29% is influence, not control. ANTA is the largest shareholder, not the owner. It can push a China strategy; it cannot simply impose one. A stake of this size typically means ANTA books a share of PUMA’s profit rather than consolidating its sales.
    • Globalisation is also a hedge. With domestic demand still soft, every extra dollar earned outside the mainland makes the group less hostage to the China consumer.

    Macro check: China CPI is up, for the wrong reason

    China’s September CPI rose 0.9% year on year, close to its biggest gain in three months. Before calling it a consumer comeback, look at the driver: higher raw material and energy costs, not stronger demand. Domestic demand remains weak.

    For a consumer brand, cost-push inflation without demand is an awkward mix. Input costs go up while shoppers keep their wallets shut, which limits pricing power and keeps discounting on the table. That is the backdrop ANTA has to trade against, and it is also why the PUMA and global angle carries more weight than another domestic store roll-out would.

    ANTA Sports 02020 stock analysis: valuation and key numbers

    MetricANTA Sports (02020)
    Last price (16 Oct close)HK$77.95
    Day change+HK$2.50 (+3.31%)
    Day rangeHK$76.65 – 78.75
    52-week rangeHK$66.85 – 89.30
    1M / 3M / 6M performance+7.74% / +5.62% / -7.37%
    YTD / 52-week performance-3.23% / -9.04%
    Market capHK$218.00B
    P/E (EPS HK$5.4397)14.33x
    TTM P/E11.76x
    Dividend yield / TTM yield3.14% / 3.32%
    DPS / payoutHK$2.45 / 45.0%
    P/B (NAV/share HK$26.182)2.98x
    SMA 10 / 50 / 100 / 25073.195 / 73.767 / 73.986 / 78.375
    RSI 10 / 14 / 2072.0 / 66.5 / 61.5
    MACD (12/25) / (8/17)0.336 / 0.779, both bullish
    Volume vs 3M average15.41M vs 7.36M
    TurnoverHK$1.20B
    Short-selling share of turnover33.9% (HK$406.35M)
    Data: AASTOCKS, as of 16 Oct 2026 close.

    What the numbers tell us (our analysis):

    • The P/E gap points to higher trailing earnings. A 14.3x P/E against 11.8x TTM implies trailing earnings above the base-year EPS. Working back from the price, TTM EPS is roughly HK$6.6 against HK$5.44. Check for one-offs before you extrapolate.
    • You are paid to wait. A 3.1% to 3.3% yield on a 45% payout is real income for a growth name. The latest HK$1.51 dividend went ex on 8 Sep and was paid on 22 Sep.
    • Not deep value. At 2.98x book this is a quality-brand multiple, not a balance-sheet bargain. The re-rating case rests on earnings, not assets.
    • Street context. Goldman Sachs’ HK$105 target sits about 35% above Friday’s close, but note that the headline was a cut with Buy maintained. Treat it as context, not a destination.

    Technical picture: the 250-day line at HK$78.4

    ANTA Sports (02020) 1-year weekly chart on AASTOCKS
    Chart: AASTOCKS, 1-year weekly, as of 16 Oct 2026

    The weekly chart tells the story of the past year: a slide from around HK$90 late last year to a June low (52-week low HK$66.85), then a base. Down 9% over 52 weeks and 3.2% year to date, the stock is up 7.7% over the past month. The 10-, 50- and 100-day SMAs are bunched between HK$73.2 and HK$74.0, and Friday’s 3.3% jump took the price clean out of that cluster.

    Now the hard part. AASTOCKS puts the 250-day SMA at HK$78.375, with the price about 0.5% below it. Some market commentary puts the 250-day bull/bear line nearer HK$76.4; different calculation methods place it anywhere in the HK$76–78 zone. We use the AASTOCKS figure, so the line is not yet cleared. Friday’s intraday high of HK$78.75 poked above it, but the close did not hold.

    Three flags:

    • Volume backs the move. 15.41M shares traded, about 2.1x the 7.36M 3-month average, and both MACD readings are bullish.
    • The bears are still here. Short selling was 33.9% of turnover, a heavy share for a large-cap.
    • Short-term stretched. RSI(10) at 72.0 is in overbought territory and RSI(14) is 66.5. A pause or pullback before any breakout would be normal.

    We flagged the same gatekeeper in our recent Kingsoft (03888) stock analysis: in this tape, the 250-day line separates a bounce from a trend change. For ANTA, a decisive close above about HK$78.4 on volume would confirm the bull case. On any pullback, the HK$73–74 moving-average cluster is the first zone that “accumulate on dips” buyers will be watching.

    Risks

    • Integration without control. A 29% non-controlling stake gives ANTA influence, not command. EUR1.506bn is committed, and the China plan depends on PUMA’s board and management agreeing to it.
    • Weak China consumption. CPI is rising on costs, not demand. If the consumer stays soft, margins across the whole portfolio feel it.
    • PUMA’s own brand issues. The bull case assumes PUMA can be fixed. If brand momentum stays weak globally, a better China business may not offset it.
    • Overbought. RSI(10) above 70 raises the odds of a near-term pullback.
    • Still below the 250-day SMA. Friday’s intraday break failed to hold at the close.
    • Heavy short selling. About a third of Friday’s turnover was short selling.
    • Target cut. Goldman Sachs kept its Buy rating but lowered its target, a reminder that estimates are moving the wrong way at the margin.

    What to watch

    1. The close above about HK$78.4. One poke intraday is not a break. Watch for closes above it on above-average volume after the market reopens on Tuesday 20 Oct.
    2. Pullback behaviour. If RSI cools, does the stock hold the HK$73–74 SMA cluster?
    3. PUMA China plan. Any detail from ANTA on how it will work with PUMA in the mainland: governance, DTC, distribution.
    4. China consumption data. Does inflation start coming from demand rather than costs?
    5. Short-selling ratio. A falling short share alongside rising prices would signal the bears are covering.

    The DimSumInsider take

    ANTA has turned a weak-consumer story into a global multi-brand story, and the PUMA stake is the clearest proof yet. The China gap (7% versus 17% to 30% for peers) is a real, simple thesis, and at 11.8x TTM P/E with a 3%+ yield you are paid while it plays out. But the chart has not confirmed it: the price sits just below the 250-day line at about HK$78.4, RSI is stretched and short sellers are active. Our approach: let the line decide. A decisive close above HK$78.4 on volume is the trigger; until then, dips towards HK$73–74 are where patient money gets the better entry. The alpha is in waiting for the market to prove the story, not in chasing the first green candle.

    FAQ

    What did ANTA Sports (02020) buy in PUMA?

    ANTA announced on 7 Oct 2026 that it had completed the purchase of about 29.06% of PUMA for EUR1.506bn, making it PUMA’s largest shareholder.

    Why could PUMA grow in China under ANTA?

    PUMA’s Greater China sales are only about 7% of its total, against 17% to 30% for global sportswear peers. Market commentary suggests ANTA’s turnaround capability and DTC model could help close part of that gap.

    Is ANTA Sports stock cheap?

    Per AASTOCKS (16 Oct 2026 close): 14.3x P/E, 11.8x TTM P/E, 2.98x book and a 3.1% yield (3.3% TTM).

    What is the key technical level for 02020?

    The 250-day SMA at about HK$78.4 (AASTOCKS). Different calculation methods put the line in the HK$76–78 zone. The stock closed at HK$77.95 on 16 Oct.

    Is the Hong Kong market open on 19 Oct 2026?

    No. HKEX is closed on Monday 19 Oct for a holiday and reopens on Tuesday 20 Oct.


    Disclaimer: For information only. Based on public market commentary and AASTOCKS data as of 16 Oct 2026 close; data may be delayed. DimSumInsider may hold positions not stated here. Consult a licensed financial adviser. This is not financial advice. Do your own research.