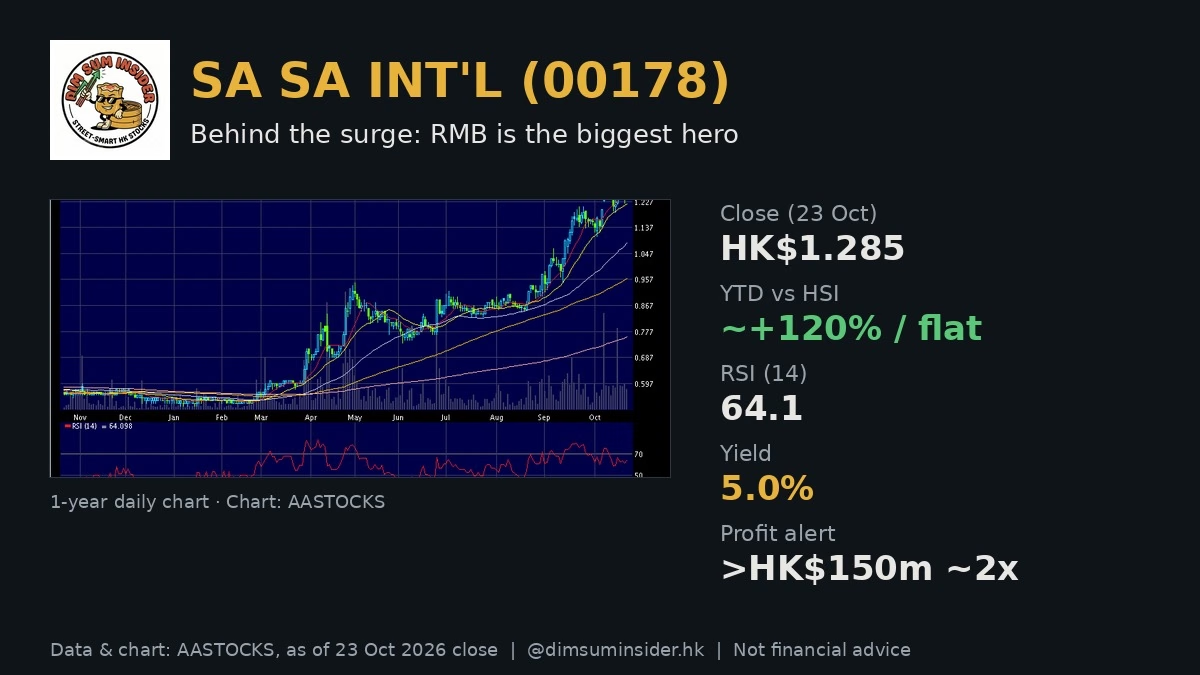
Sa Sa International (00178) closed Friday at HK$1.285, and the stock has roughly doubled-plus year to date while the Hang Seng Index has gone nowhere. This Sa Sa 00178 stock analysis asks the alpha question: is the hero the cosmetics shelves, or the RMB making Hong Kong look cheap again for mainland shoppers?
Market commentary notes put the currency first. HKD/RMB has slipped from near 0.95 in April last year to near 0.85 recently — about a 15% “discount” for mainland visitors — and Golden Week sales plus a fresh profit alert are starting to show up in the numbers.
The news in brief
- RMB as the silent promo. Market commentary notes that queues have quietly returned on Canton Road. With HKD/RMB near 0.85 versus ~0.95 a year earlier, mainland spending in Hong Kong is effectively on sale; the 2018 pre-pandemic rate near 0.8 is the level the commentary is watching.
- Record National Day arrivals. Official figures cited in the notes: on 1 Oct mainland visitor arrivals hit 277,000, a post-2023 reopening single-day record and above the 2018 pre-pandemic peak of 260,000.
- Golden Week at Sa Sa. Hong Kong and Macau total sales rose over 60% YoY; same-store sales rose over 50%.
- Positive profit alert. Sa Sa expects net profit of more than HK$150m for the six months ending September, nearly double year on year.
- Stock vs index. Commentary chart: from a 2 Jan 2026 baseline of 0, Sa Sa is up about 1.2x (~120%) into October while the HSI is flat to slightly down.
- Luxury weak, value cosmetics thrive. A Bloomberg report cited in the notes: in August–September, sales for 25 major luxury brands in mainland China — including Hermès, Cartier, LV and Gucci — fell by double digits YoY. Value-for-money imported cosmetics are the relative winners.
- Peak-year context. Sa Sa’s most profitable year was 2014, with net profit above HK$900m, when HKD/RMB was also near 0.8.
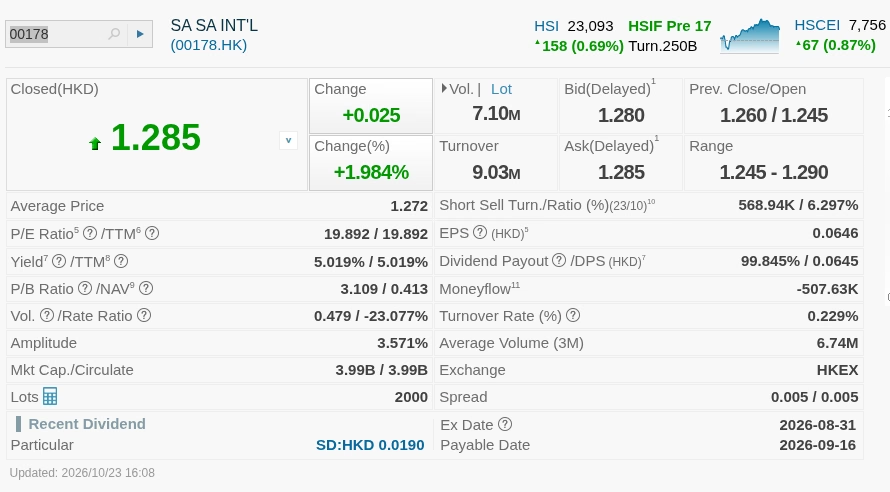
- Friday tape (AASTOCKS). Last HK$1.285 (+0.025 / +1.984%), prev 1.260, open 1.245, day 1.245–1.290. Markets are closed over the weekend; this is the 23 Oct 2026 close.
Why RMB tourism matters for Sa Sa
Sa Sa is a classic Hong Kong and Macau cosmetics retailer: shelves aimed at travellers and locals who want imported brands without luxury mark-ups. When the yuan strengthens against the Hong Kong dollar, every lipstick and serum looks cheaper to a mainland visitor. Market commentary notes call that a built-in 八五折 (about 15% off) at ~0.85, and they contrast it with 2018’s ~0.8 level when tourist spend was still booming.
The visitor print on National Day backs the story: 277,000 mainland arrivals in a single day, above the 2018 peak. That footfall showed up in Sa Sa’s own Golden Week numbers — total sales +60%+ and same-store +50%+ across Hong Kong and Macau — and then in the profit alert for the half to September.
The other side of the ledger is mainland luxury. Hermès, Cartier, LV, Gucci and peers are seeing double-digit mainland sales declines, per the Bloomberg survey of 25 brands for August–September. The cultural shift toward 性價比 (value for money), plus a negative wealth effect from soft mainland stocks and property, makes a high-street cosmetics chain a cleaner tourism proxy than a Canton Road maison.
What still has to go right
- The FX stays favourable. If HKD/RMB rebounds toward 0.95, the “discount” shrinks.
- Visitor quality, not just volume. Golden Week was strong; sustaining same-store growth into quieter months is the test.
- Luxury does not steal the wallet back. A sudden rebound in mainland luxury spend would compete for the same tourist dollar.
Sa Sa 00178 stock analysis: valuation and key numbers
| Metric | Sa Sa Int’l (00178) |
|---|---|
| Last price (23 Oct close) | HK$1.285 |
| Day change | +HK$0.025 (+1.984%) |
| Prev close / open | HK$1.260 / HK$1.245 |
| Day range | HK$1.245 – 1.290 |
| 52-week range | HK$0.517 – 1.350 (+130.70%) |
| Market cap | HK$3.99B |
| P/E (EPS 0.0646) | 19.892x |
| P/B (NAV 0.413) | 3.109x |
| Dividend yield | 5.019% |
| SMA 10 / 20 / 50 | 1.261 / 1.219 / 1.083 |
| SMA 100 / 250 | 0.961 / 0.758 |
| RSI 14 | 64.10 |
| MACD (12,26) / signal / div | 0.052 / 0.056 / -0.003 |
| Volume / turnover | 7.10M / HK$9.03M |
| Short-sell ratio (23/10) | 6.297% |
| Operating / FX checkpoints (market commentary) | Figure |
|---|---|
| HKD/RMB (Apr last year → recent) | ~0.95 → ~0.85 (~15% discount) |
| HKD/RMB 2018 / Sa Sa peak profit year 2014 | ~0.8 / net profit >HK$900m |
| Mainland arrivals 1 Oct | 277,000 (above 2018 peak 260,000) |
| Golden Week HK+Macau sales / same-store | +60%+ / +50%+ YoY |
| Profit alert (6m to Sep) | Net profit >HK$150m, nearly 2x YoY |
| YTD vs HSI (chart from 2 Jan 2026) | Sa Sa ~+120%; HSI flat/slightly down |
What the numbers tell us (our analysis):
- Re-rating already happened. From the 52-week low near HK$0.52 to HK$1.285 is a more than doubling; P/E near 20x and P/B above 3x are no longer deep-value prints.
- Yield still cushions. A 5.0% trailing yield at this price is rare for a stock that has already run ~120% YTD — but payout can cut if earnings miss.
- Momentum is strong, not extreme. RSI(14) at 64 sits below classic overbought; price is above the 10- through 250-day SMAs in bullish stack (1.26 > 1.22 > 1.08 > 0.96 > 0.76).
- MACD warning flicker. MACD 0.052 vs signal 0.056 (div -0.003) is a small bearish cross after a long run — watch for follow-through, not a panic print.
- Shorts are present. A 6.3% short-sell ratio is elevated enough to matter on a down day, but not a crowded wipeout setup.
Technical analysis: above every average, near the highs
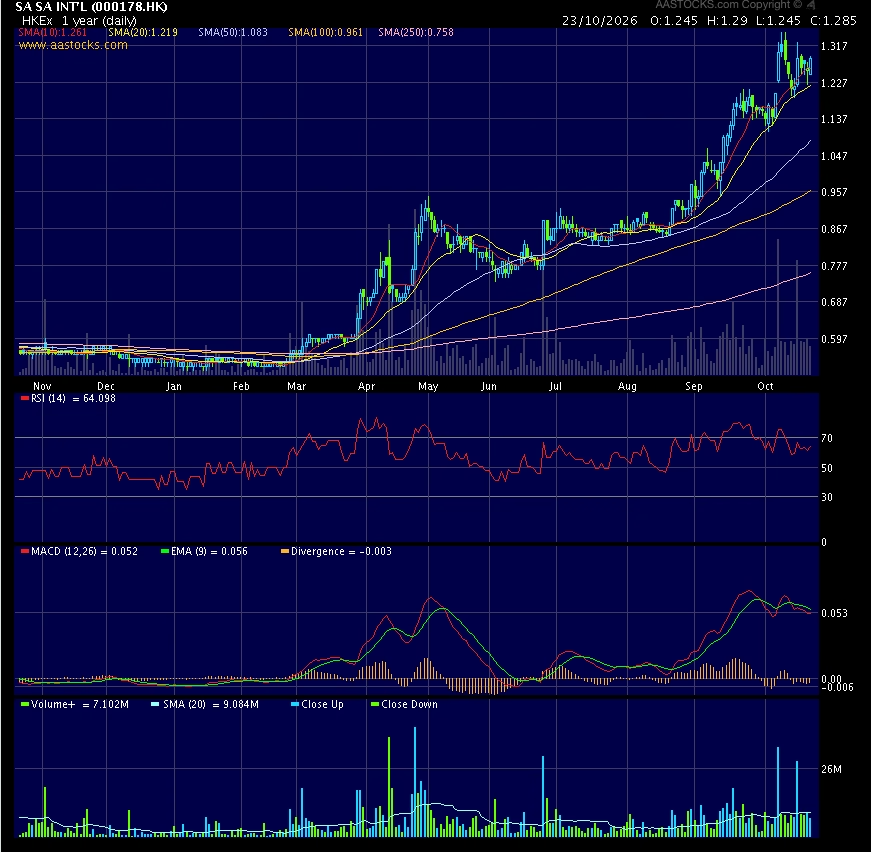
The one-year AASTOCKS chart shows a quiet base near HK$0.60 into early 2026, a breakout from March, a May peak near the mid-0.80s, summer consolidation, then a near-vertical climb from August into the HK$1.30 area. Friday’s close at HK$1.285 sits just under the 52-week high of HK$1.350.
- Bullish SMA stack. All five listed averages slope up beneath price. First support is the 10-day SMA near HK$1.261, then the 20-day near HK$1.219.
- RSI mid-strong. At 64, there is room before 70; the stock is trending, not frothing.
- MACD cooling. A tiny negative histogram after a big run often precedes a pause or a shallow pullback rather than a crash — unless volume dumps on a break of the 10-day.
- Resistance overhead. HK$1.29–1.35 is the day-high / 52-week-high band. A clean close above HK$1.35 would extend the breakout; failure here invites mean-reversion toward the 10- and 20-day lines.
Levels: first support HK$1.261 (SMA10) and HK$1.219 (SMA20); deeper trend support HK$1.083 (SMA50). Resistance HK$1.290 (Friday high) then HK$1.350 (52-week high).
Bull case vs bear case
Bull case
- Stronger RMB (~0.85 vs ~0.95) keeps giving mainland tourists a built-in discount.
- National Day arrivals at 277,000 beat the 2018 peak; Golden Week HK+Macau sales +60%+ and same-store +50%+.
- Profit alert: >HK$150m net for the half to September, nearly 2x YoY.
- Luxury brands in double-digit mainland decline; value cosmetics take share.
- 2014 peak (>HK$900m profit at ~0.8 FX) is the nostalgia upside if tourism fully normalises.
Bear case
- Stock already up ~120% YTD and ~131% off the 52-week low; P/E ~20x, P/B ~3.1x.
- FX can reverse; a move back toward 0.95 removes the “discount” narrative.
- Visitor spend quality may disappoint even if arrivals stay high (negative wealth effect).
- MACD just slipped under its signal; short-sell ratio ~6.3% can amplify a pullback.
- Half-year profit >HK$150m is still far below the 2014 peak — the story is recovery, not a new golden age yet.
Levels to watch
- HK$1.350. 52-week high. A close above opens further upside.
- HK$1.290. Friday’s high; near-term supply.
- HK$1.261 (10-day SMA). First trend support; a close below is an early caution.
- HK$1.219 (20-day SMA). Momentum traders’ second line.
- HK$1.083 (50-day SMA). Break of the intermediate uptrend.
- HKD/RMB near 0.85 vs 0.95. The fundamental driver behind the tourism thesis.
The DimSumInsider take
Sa Sa is a clean trade on RMB + mainland footfall + value cosmetics, not a luxury recovery story. The profit alert and Golden Week sales confirm the thesis is live, but the chart has already paid a lot of it. Our approach: respect the trend above the 10- and 20-day averages, treat HK$1.35 as the breakout line, and size for FX and tourism data — not for a straight line back to 2014’s HK$900m profit year. The alpha is riding the discount while it lasts, with a hard stop if the SMA stack breaks.
FAQ
What does Sa Sa (00178) do?
Sa Sa International is a Hong Kong-listed cosmetics and personal-care retailer focused on Hong Kong and Macau stores that sell imported beauty products, popular with locals and mainland tourists.
Why has 00178 risen so much in 2026?
Market commentary notes credit a stronger RMB (HKD/RMB ~0.95 → ~0.85), record National Day mainland arrivals, Golden Week sales up over 60% YoY, and a profit alert for more than HK$150m net profit in the six months to September.
What are the key Sa Sa valuation numbers?
At the 23 Oct 2026 close of HK$1.285: P/E 19.9x, P/B 3.1x, yield 5.0%, market cap HK$3.99B (AASTOCKS). RSI(14) is 64.1; the stock sits above its 10- through 250-day SMAs.
What levels matter for Sa Sa stock?
Support at HK$1.261 (SMA10), HK$1.219 (SMA20) and HK$1.083 (SMA50); resistance at HK$1.290 and the 52-week high of HK$1.350.
Is this a buy after a 120% run?
That depends on your risk tolerance. The fundamental tourism/FX story is intact, but valuation and the chart are no longer cheap. Use levels and a stop; this is not financial advice.
Disclaimer: For information only. Based on public market commentary notes and AASTOCKS data as of 23 Oct 2026 close; data may be delayed. DimSumInsider may hold positions not stated here. Consult a licensed financial adviser. This is not financial advice. Do your own research.