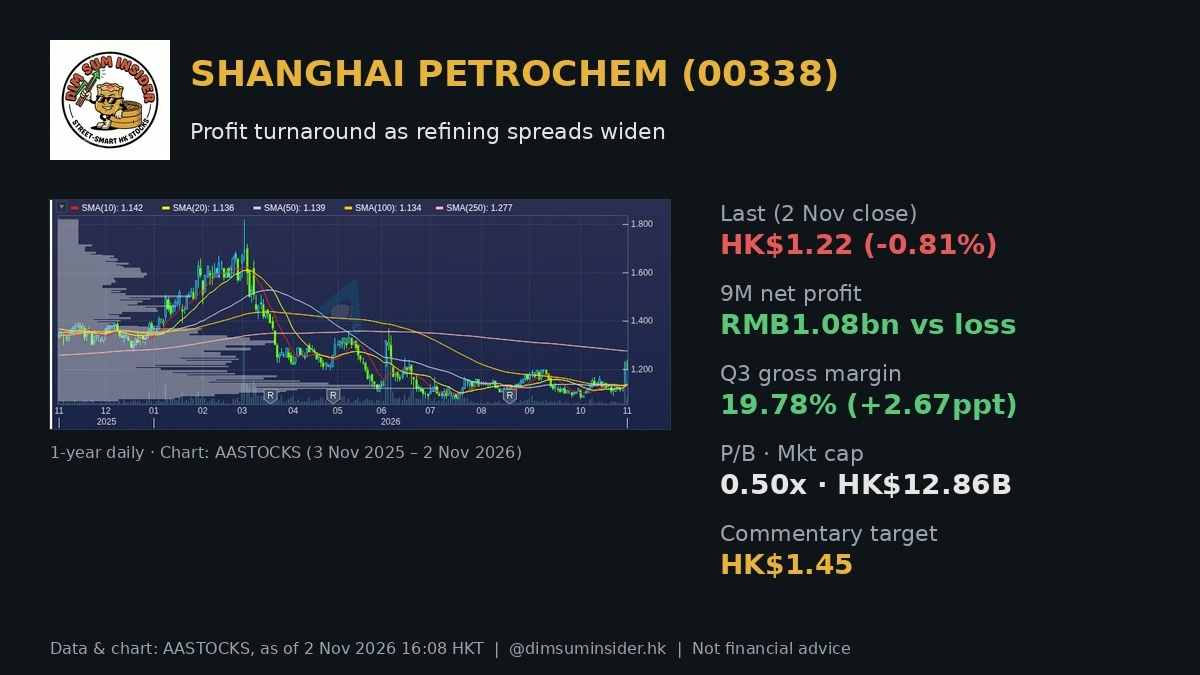
Tag: Q3 results

  • Shanghai Petrochemical (00338): Refining Spreads Power a Profit Turnaround

    Shanghai Petrochemical (00338): Refining Spreads Power a Profit Turnaround

    Sinopec Shanghai Petrochemical (00338), listed as SHANGHAI PECHEM on AASTOCKS, jumped 10.3% to HK$1.23 on Friday 30 Oct after its nine-month results, then eased 0.8% to HK$1.22 on Monday 2 Nov. This Shanghai Petrochemical 00338 stock analysis asks one question: is this a real margin recovery or a one-quarter spike? The stock trades at 0.50x book and still shows “No Profit” on a trailing basis, while Q3 profit jumped about 24.6 times year on year.

    Market commentary notes see a recovery that is gathering pace. Their view: accumulate near HK$1.20, with a first target of HK$1.45. We think the turnaround is real. How long it lasts depends on refining spreads that are being held up by geopolitics.
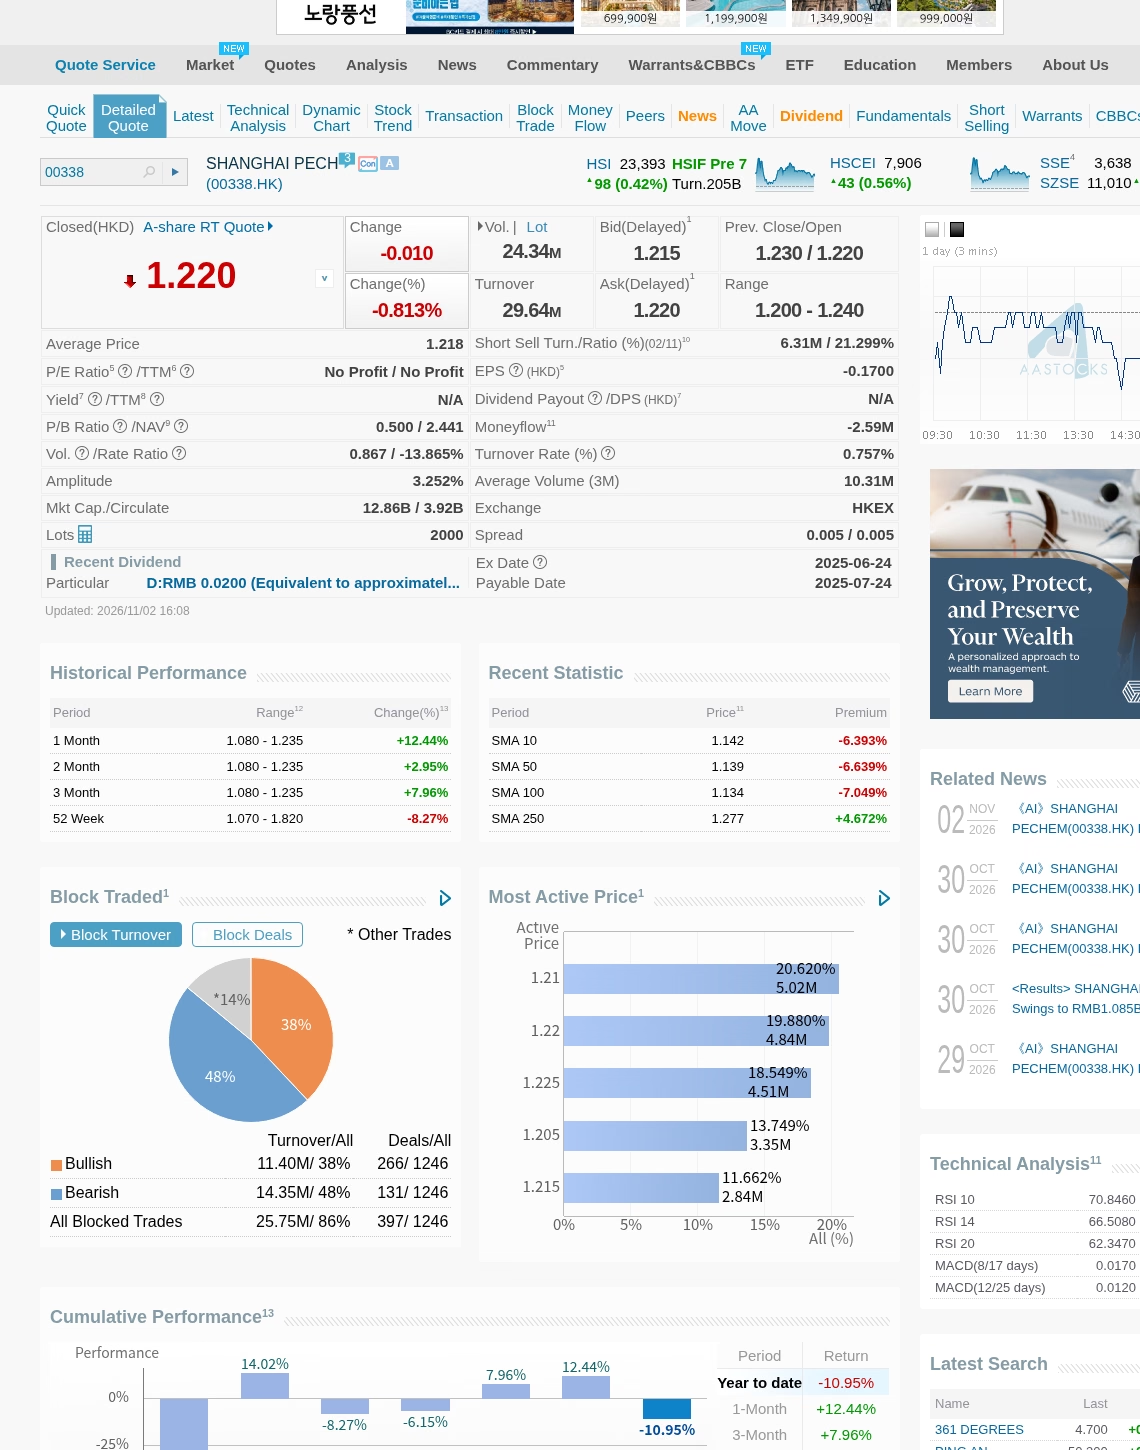
    Shanghai Petrochemical (00338) detailed quote on AASTOCKS, 2 Nov 2026 16:08 HKT
    Source: AASTOCKS, as of 2 Nov 2026 16:08 HKT

    Key takeaways

    • Back in profit. 9M net profit was RMB 1.08bn, against a loss of RMB 0.43bn a year earlier. Recurring profit was RMB 1.16bn (loss of RMB 0.39bn a year ago).
    • Q3 drove it. Q3 revenue rose 7.9% to RMB 20.86bn and profit was RMB 0.78bn, up about 24.6x year on year. That is about 2.6 times H1’s RMB 0.30bn profit.
    • Margins widened. Q3 gross margin was 19.78% (+2.67 ppt YoY, +3.92 ppt QoQ). Net margin was 3.63% (+3.47 ppt YoY, +4.26 ppt QoQ).
    • Spreads, not volume. Better refining and chemical product spreads did the work, helped by refinery outages linked to geopolitics.
    • Cheap on book. AASTOCKS shows P/B 0.50 (NAV HK$2.441) and a market cap of HK$12.86B. Trailing P/E still shows “No Profit”.
    • Price action. Friday +10.3% to HK$1.23, Monday −0.8% to HK$1.22. The 52-week range is HK$1.07–1.82.

    9M and Q3 results at a glance

    Item9M 2026Year earlierChange
    RevenueRMB 59.85bn—+1.7% YoY
    Net profitRMB 1.08bnLoss RMB 0.43bnTurned to profit
    Recurring net profitRMB 1.16bnLoss RMB 0.39bnTurned to profit
    Gross margin18.71%—+1.84 ppt
    Net margin1.74%—+2.47 ppt
    ItemQ3 2026Change
    RevenueRMB 20.86bn+7.9% YoY
    Net profitRMB 0.78bn~24.6x YoY; ~2.6x H1 profit
    Gross margin19.78%+2.67 ppt YoY, +3.92 ppt QoQ
    Net margin3.63%+3.47 ppt YoY, +4.26 ppt QoQ
    Source: company results as reported in market commentary notes. H1 2026: revenue RMB 38.992bn (−1.34% YoY), profit RMB 0.30bn vs a loss of RMB 0.462bn.

    Margin recovery: the quarter that changed the story

    H1 was barely profitable: revenue slipped 1.34% and profit was only RMB 0.30bn. Q3 changed that. Revenue grew 7.9%, but profit rose far faster, because the gross margin gained almost 4 ppt in a single quarter. For a refiner this is operating leverage at work. Feedstock is most of the cost base, so a few points of spread drop almost straight to the bottom line.

    Commentary notes describe this as the company getting out of its “high cost, low margin” bind. The recurring profit (RMB 1.16bn) is higher than the headline figure, so the improvement is not driven by one-off gains. A 1.74% nine-month net margin is still thin, though. The business stays very sensitive to spreads in both directions.

    Refining spreads and geopolitical supply drivers

    The main driver is outside the company’s control. According to market commentary notes:

    • Refinery damage. The US–Iran conflict and the Russia–Ukraine war have damaged refining facilities. Goldman Sachs estimates refinery outages of about 5.8 million barrels a day (an analyst estimate, not a verified figure).
    • Low inventories. Refined product inventories are low, so supply is tight and unlikely to ease in the short term.
    • Refining recovers slowly. Analysts note that even if the conflicts ease, refining capacity is likely to recover last. Oilfields can restart once transport resumes, but damaged refineries take a long time to repair. That should keep product prices high in the near to medium term.

    For a mainland refiner that is still running, this is a favourable setup: crude is available while product cracks stay wide. The flip side is that the tailwind comes from disruption. A faster-than-expected repair cycle or a ceasefire-driven drop in prices could narrow spreads quickly.

    Shanghai Petrochemical 00338 stock analysis: valuation

    MetricShanghai Petrochemical (00338)
    Last price (2026/11/02 close)HK$1.220
    Day change−HK$0.010 (−0.813%)
    Prev close / openHK$1.230 / HK$1.220
    Day rangeHK$1.200 – 1.240
    52-week rangeHK$1.070 – 1.820
    Market capHK$12.86B
    P/E / TTM P/ENo Profit / No Profit
    P/B (NAV HK$2.441)0.500x
    Dividend yieldN/A (last div RMB 0.02, ex 2025-06-24)
    Volume / turnover24.34M / HK$29.64M
    Data: AASTOCKS, updated 2026/11/02 16:08 HKT, market Closed; quotes delayed.
    Commentary checkpointsFigure
    Forward P/E~10x
    DividendFinal dividend expected to resume after profit recovery
    Entry zoneAccumulate on dips near HK$1.20
    First targetHK$1.45 (~19% above HK$1.22)
    Source: market commentary notes (forward-looking views and estimates, not AASTOCKS data).

    What the numbers tell us (our analysis):

    • Trailing vs forward. Trailing earnings are still negative (EPS −0.17 on AASTOCKS), so trailing P/E means nothing here. The ~10x forward figure assumes the Q3 run rate holds.
    • Book value is the anchor. At 0.50x NAV, the market is still pricing the company as a loss-maker. A sustained return to profit is what would close that gap.
    • The dividend is the catalyst. No dividend has been paid on the latest numbers. A resumed final dividend would be a clear signal for income investors.

    Technical analysis: breaking out of the base
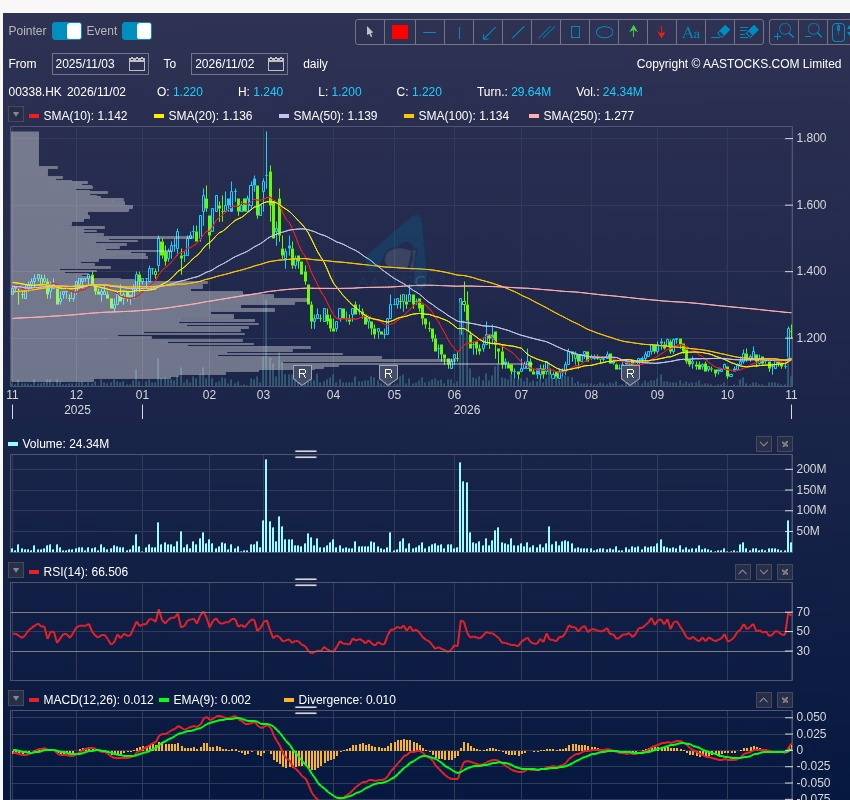
    Shanghai Petrochemical (00338) one-year daily chart on AASTOCKS
    Source: AASTOCKS, as of 2 Nov 2026 16:08 HKT; 1-year daily chart

    The AASTOCKS one-year daily chart (3 Nov 2025 to 2 Nov 2026) shows a run to about HK$1.82 in March and a slide to a two-year low near HK$1.07. Since around July the stock has traded in a HK$1.07–1.20 box. Friday’s jump took it to the top of that box, and it held most of the gain on Monday.

    • Moving averages. The price of 1.22 is above SMA10 1.142, SMA20 1.136, SMA50 1.139 and SMA100 1.134, which are all bunched together. It is still below SMA250 1.277.
    • Momentum. RSI(14) is 66.5, close to overbought (RSI10 is 70.8). MACD(12,26) is 0.012 against a signal of 0.002, so the crossover is bullish.
    • Support. HK$1.20 (top of the box and the Monday low), then HK$1.13–1.14 (the SMA cluster), then HK$1.07.
    • Resistance. HK$1.24 (Monday high), then HK$1.277 (SMA250), then the commentary’s HK$1.45 target.

    Risks

    • Spread reversal. If geopolitical tension eases or repaired refineries come back faster than expected, crack spreads could compress quickly.
    • Crude cost spikes. A sharp rise in crude without matching product prices would squeeze margins again.
    • Thin margins. A 1.74% nine-month net margin leaves little buffer.
    • Policy and pricing. Mainland fuel pricing and the policy environment can cap how much of the spread is captured.
    • Technical risk. RSI is near overbought after a 10% day, and the stock is still below SMA250. A drop back into the box would weaken the breakout.
    • Dividend uncertainty. A resumed final dividend is an expectation, not an announcement.

    The DimSumInsider take

    Shanghai Petrochemical’s Q3 shows how quickly a refiner’s earnings can turn when spreads move. Profit rose about 24.6x, gross margin gained nearly 4 ppt in a quarter, and recurring profit is ahead of the headline number. At 0.50x book, the market is not yet paying for the recovery. Our approach is in line with the commentary: build positions near HK$1.20, look for a close above SMA250 (HK$1.277) as confirmation, and treat HK$1.45 as the first target. Cut if the price falls back below the HK$1.13 moving-average cluster. Keep watching refining spreads. They drove the turnaround, and they are also the main risk.

    FAQ

    What were Shanghai Petrochemical’s 9M 2026 results?

    Revenue was RMB 59.85bn (+1.7% YoY). Net profit was RMB 1.08bn, against a loss of RMB 0.43bn a year earlier. Recurring profit was RMB 1.16bn. Gross margin was 18.71% and net margin 1.74%.

    Why did 00338 jump 10.3%?

    The nine-month results released on Friday showed Q3 profit of RMB 0.78bn, up about 24.6x year on year. The shares rose 10.3% to HK$1.23, then fell 0.8% to HK$1.22 on Monday.

    What is Shanghai Petrochemical’s valuation?

    According to AASTOCKS as of 2026/11/02 close: HK$1.22, P/B 0.50, market cap HK$12.86B, and a trailing P/E of “No Profit”. Market commentary notes put the forward P/E at about 10x.

    What levels matter for 00338?

    Support is at HK$1.20, then HK$1.13–1.14, then HK$1.07. Resistance is at HK$1.24, then HK$1.277 (SMA250), then HK$1.45.


    Disclaimer: For information only. Based on public market commentary notes, company results as reported, and AASTOCKS data as of 2026/11/02 16:08 HKT (market Closed); data may be delayed. The refinery-outage figure is a third-party analyst estimate, and forward figures are estimates. DimSumInsider may hold positions not stated here. Consult a licensed financial adviser. This is not financial advice. Do your own research.
  • Ping An (02318): Core Profit Steady Behind a −93.7% Headline — Keep Holding

    Ping An (02318): Core Profit Steady Behind a −93.7% Headline — Keep Holding

    Ping An Insurance (02318) — PING AN on AASTOCKS — closed at HK$49.740 on 30 Oct (+0.120 / +0.242%) after a +2.56% pop to HK$49.62 the session before. This Ping An 02318 stock analysis asks the alpha question: when Q3 net profit collapses 93.7% but after-tax operating profit grows 8.3%, is the headline a value trap or a mark-to-market noise opportunity at roughly 5.8x earnings and a ~6% yield?

    Market commentary notes read the print as “core business steady”: the net-profit hit came from fair-value losses as China’s A-share market corrected in Q3, not from the insurance engine. Their stance is to keep holding, with a medium-term target of HK$70. Broker research from Morgan Stanley stays Overweight with a HK$85 target. Our view is close to theirs: own the operating profit and the dividend, but accept that the chart is still in a downtrend channel and needs repair.

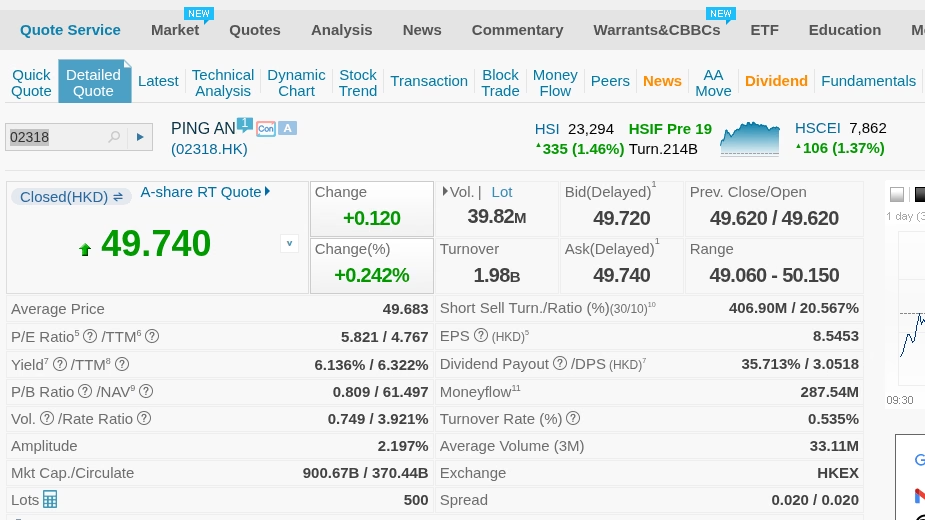
    Ping An (02318) detailed quote on AASTOCKS, 30 Oct 2026 16:08 HKT
    Source: AASTOCKS, as of 30 Oct 2026 16:08 HKT

    The news in brief

    • Q3 headline (RMB). Revenue about 1,530億 = RMB 153.0bn (−54% YoY); net profit 40.60億 = RMB 4.06bn (−93.7% YoY), mainly from fair-value losses on equity holdings as A-shares corrected.
    • 9M (RMB). Revenue 7,281.34億 = RMB 728.13bn (−12.6%); net profit 966.45億 = RMB 96.65bn (−27.3%), versus +36.1% at the H1 stage.
    • The number that matters. Q3 after-tax operating profit about RMB 41.7bn; 9M operating profit about RMB 125.9bn, both +8.3% YoY. Strip out short-term investment swings and the core business grew.
    • Franchise. The “integrated finance + health care and elderly care” model spans life and health, P&C, pensions, banking, asset management, trust and securities. About 256m customers at end-September; 99% 12-month retention for customers holding 3+ product categories.
    • Broker view. Morgan Stanley calls Q3 operating profit resilient, attributes a weaker single-quarter new business value (VNB) print mainly to a high base, expects mid-single-digit full-year DPS growth, is confident in medium-term double-digit VNB growth, and keeps Overweight, TP HK$85.
    • Friday close (AASTOCKS, 30 Oct 2026 16:08 HKT). Last HK$49.740, open/prev close 49.620, day 49.060–50.150, volume 39.82M, turnover HK$1.98B. Hang Seng Index 23,294 (+1.46%). Market Closed.

    Why a −93.7% profit print is not a broken insurer

    Under IFRS 17 / IFRS 9, a big chunk of an insurer’s equity book is marked through profit and loss. When A-shares fall in a quarter, reported net profit swings hard, and Ping An’s Q3 is a textbook case. Operating profit is the metric management and analysts use to strip that noise out, and it rose 8.3% in both Q3 and 9M.

    That is why the dividend debate matters more than the headline. Ping An’s dividend policy is tied to operating profit, not reported net profit, so a resilient operating line plus Morgan Stanley’s mid-single-digit DPS growth call supports a yield floor around 6% at current prices.

    What still has to go right

    1. A-shares stabilise. Another quarter of equity correction means more fair-value noise and more negative headlines, even if operating profit holds.
    2. VNB growth resumes. The high-base excuse covers one quarter; the medium-term double-digit VNB thesis needs proof in 2027.
    3. Dividend delivered. Mid-single-digit DPS growth keeps the yield case intact; a cut would break it.
    4. Technical repair. Reclaim SMA20 50.24, then SMA50 52.98, to escape the downtrend channel.

    Ping An 02318 stock analysis: valuation and key numbers

    MetricPing An (02318)
    Last price (30 Oct 16:08)HK$49.740
    Day change+HK$0.120 (+0.242%)
    Prev close / openHK$49.620 / HK$49.620
    Day rangeHK$49.060 – 50.150
    52-week rangeHK$47.680 – 74.700
    Market cap / circulating (H)HK$900.67B / 370.44B
    P/E / TTM P/E (EPS HK$8.5453)5.821x / 4.767x
    P/B (NAV HK$61.497)0.809x
    Dividend yield / TTM / DPS6.136% / 6.322% / HK$3.0518
    Payout35.713%
    SMA 10 / 20 / 5049.081 / 50.238 / 52.984
    SMA 100 / 25054.101 / 59.637
    RSI 1440.864
    MACD (12,26) / signal / div−1.146 / −1.229 / 0.083
    Volume / turnover39.82M / HK$1.98B
    Short-sell ratio (30/10)20.567%
    Data: AASTOCKS, updated 30 Oct 2026 16:08 HKT, market Closed; quotes delayed. SMA20, RSI and MACD from the AASTOCKS daily chart.
    Results and commentary checkpointsFigure
    Q3 revenue / YoY~RMB 153.0bn / −54%
    Q3 net profit / YoYRMB 4.06bn / −93.7%
    9M revenue / YoYRMB 728.13bn / −12.6%
    9M net profit / YoYRMB 96.65bn / −27.3% (H1: +36.1%)
    Q3 / 9M after-tax operating profit~RMB 41.7bn / ~RMB 125.9bn (both +8.3%)
    Customers (end-Sep)~256m
    12-month retention, 3+ categories99%
    Morgan StanleyOverweight, TP HK$85
    Commentary PE / yield~5.8x trailing; 6.15% trailing, ~6.5% expected
    Commentary stanceKeep holding; medium-term target HK$70
    Source: figures cited in market commentary notes and Morgan Stanley broker research; AASTOCKS for the quote table. 億 = 100m: 40.60億 = RMB 4.06bn; 966.45億 = RMB 96.645bn.

    What the numbers tell us (our analysis):

    • The PE figures line up. Commentary’s ~5.8x trailing PE matches AASTOCKS’ headline P/E 5.821x. AASTOCKS also shows a lower TTM P/E of 4.767x; we quote both and anchor on 5.8x.
    • The yield is roughly the same too. Commentary cites 6.15% trailing; AASTOCKS shows 6.136% (TTM 6.322%) on DPS HK$3.0518. The ~6.5% forward figure is the commentary’s estimate, not an AASTOCKS print.
    • Below book. P/B 0.81x against NAV HK$61.50 prices in a lot of bad news for a franchise growing operating profit 8%.
    • Payout has room. A ~36% payout leaves space for the DPS growth Morgan Stanley expects.
    • Shorts are active. A 20.6% short-sell ratio means rallies will be contested.

    Technical analysis: still inside the downtrend channel

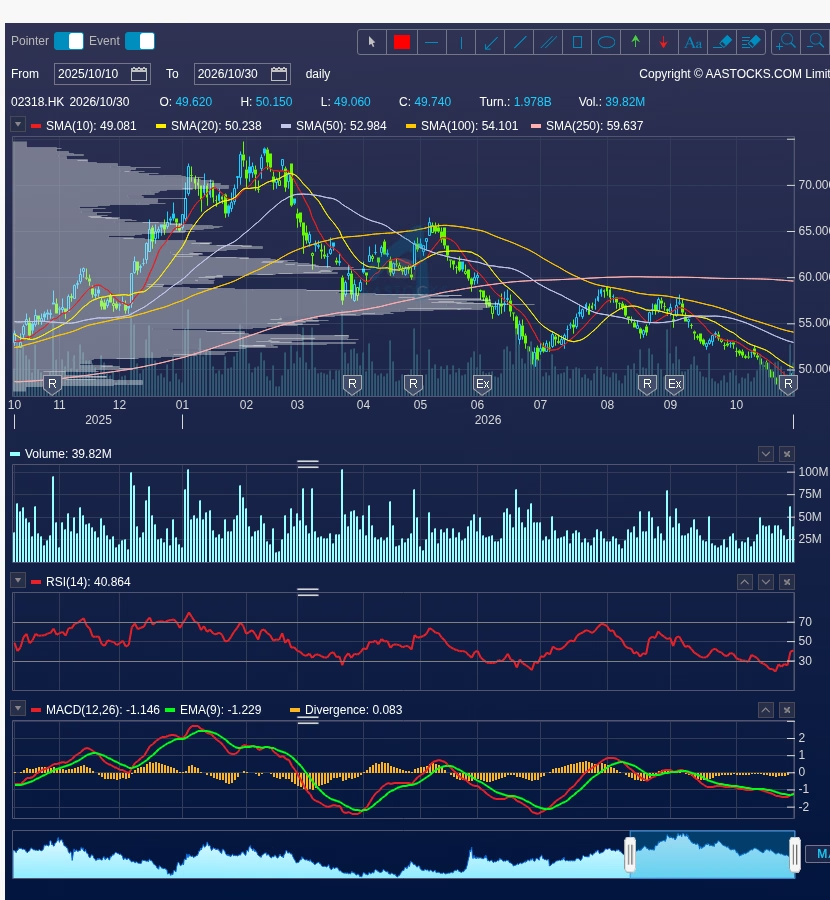
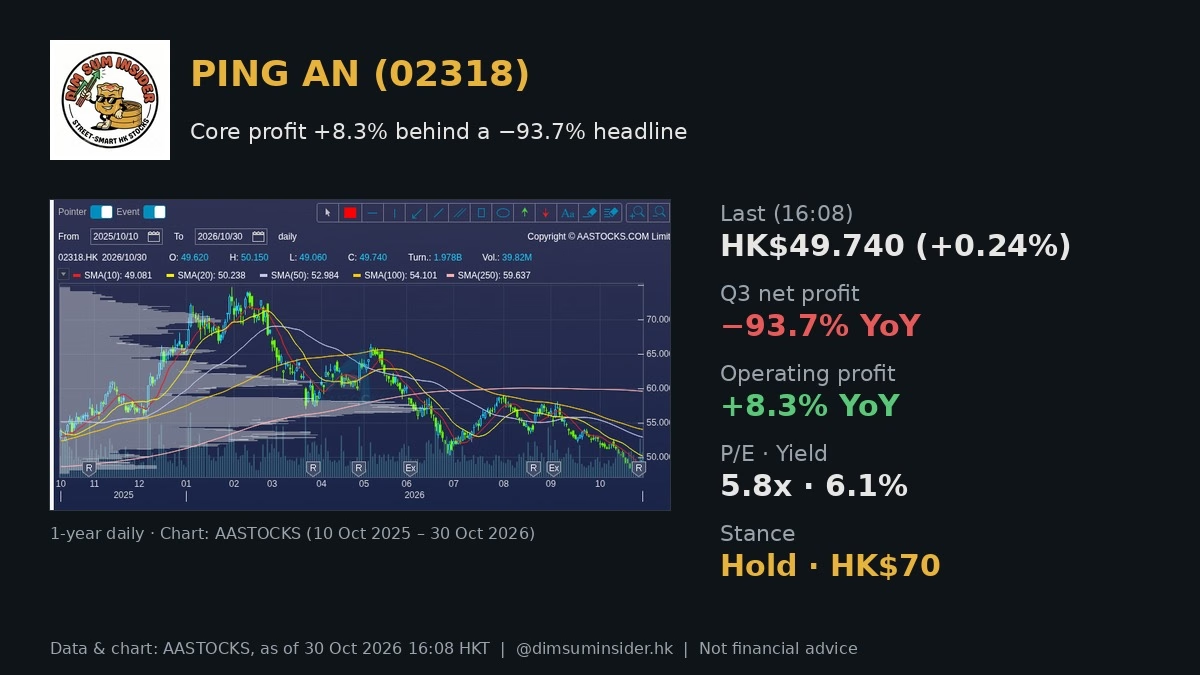
    Ping An (02318) one-year daily chart on AASTOCKS
    Source: AASTOCKS, as of 30 Oct 2026 16:08 HKT; 1-year daily chart

    The AASTOCKS one-year daily chart (10 Oct 2025 to 30 Oct 2026) shows a run from the mid-50s to a high near HK$74.70 in early 2026, then a steady staircase of lower highs and lower lows into the high-40s. The price sits just above SMA10 49.08 but below SMA20 50.24, SMA50 52.98, SMA100 54.10 and SMA250 59.64, a fully bearish moving-average stack.

    • Momentum is basing. RSI(14) 40.9 has turned up from the low-30s, and MACD (−1.146) has just crossed above its signal (−1.229) with a positive divergence of +0.083. That is an early turn, not a trend change.
    • Support. The 52-week low HK$47.68 is the line that matters; the day low 49.06 comes first.
    • Resistance. HK$50.15–50.24 (day high / SMA20), then HK$52.98 (SMA50) and ~54.1 (SMA100). A close above SMA50 would be the first real break of the channel.

    Bull case vs bear case

    Bull case

    • Operating profit +8.3% in Q3 and 9M; the net-profit collapse is mark-to-market noise.
    • About 5.8x PE, 0.81x book and a ~6.1% yield (commentary expects ~6.5%).
    • Morgan Stanley Overweight, TP HK$85; mid-single-digit DPS growth; double-digit VNB growth medium term.
    • A cross-selling franchise: 256m customers, 99% retention for 3+ category holders.
    • MACD bullish crossover and RSI rising from oversold territory near the 52-week low.

    Bear case

    • A-share weakness keeps hitting reported profit; headlines stay ugly.
    • Single-quarter VNB was weak; the high-base explanation needs confirming next year.
    • Fully bearish SMA stack; the downtrend channel since early 2026 is intact.
    • Short-sell ratio above 20%.
    • China rates and the property/credit backdrop weigh on investment yields.

    Levels to watch

    1. HK$47.68 (52-week low). A break would invalidate the base and open new lows.
    2. HK$49.06–49.08 (day low / SMA10). Near-term pivot.
    3. HK$50.15–50.24 (day high / SMA20). First repair level.
    4. HK$52.98 (SMA50). Channel-break confirmation.
    5. HK$54.1 / 59.6 (SMA100 / SMA250). Heavier supply on the way to the HK$70 medium-term target.
    6. Fundamentals. A-share direction, Q4 VNB and the final DPS.

    The DimSumInsider take

    Ping An is a value-and-yield hold with a mark-to-market headache, not a broken story. The franchise grew after-tax operating profit 8.3% while the A-share correction wiped out reported Q3 profit. At 5.8x earnings, 0.81x book and a ~6% yield backed by operating profit, the commentary’s keep-holding call and HK$70 medium-term target look reasonable, and Morgan Stanley’s HK$85 is the upside case. Our approach: hold core positions while HK$47.68 holds, add on a close above SMA50 (HK$52.98), and collect the dividend while waiting. The edge here is patience, because the market is pricing the noise and not the engine.

    FAQ

    Why did Ping An’s Q3 net profit fall 93.7%?

    Mainly fair-value losses on equity investments as China’s A-share market corrected in Q3. After-tax operating profit, which strips out short-term investment swings, rose 8.3% to about RMB 41.7bn.

    Is Ping An’s dividend safe?

    The dividend is linked to operating profit, which is growing. Morgan Stanley expects mid-single-digit full-year DPS growth. AASTOCKS shows a 6.136% yield (TTM 6.322%) with a ~36% payout.

    What are the key Ping An valuation numbers?

    At AASTOCKS 16:08 HKT on 30 Oct 2026 (HK$49.740, market Closed): P/E 5.821x (TTM 4.767x), P/B 0.809x, yield 6.136%, market cap HK$900.67B. Commentary’s ~5.8x PE and 6.15% yield are consistent with this.

    What price targets are out there?

    Market commentary notes set a medium-term target of HK$70 with a keep-holding stance. Morgan Stanley rates Ping An Overweight with a HK$85 target.

    What levels matter for 02318?

    Support HK$49.06 then the 52-week low HK$47.68; resistance HK$50.24 (SMA20), HK$52.98 (SMA50), HK$54.1 (SMA100) and HK$59.6 (SMA250).


    Disclaimer: For information only. Based on public market commentary notes, Morgan Stanley broker research as reported, and AASTOCKS data as of 30 Oct 2026 16:08 HKT (market Closed); data may be delayed. DimSumInsider may hold positions not stated here. Consult a licensed financial adviser. This is not financial advice. Do your own research.