
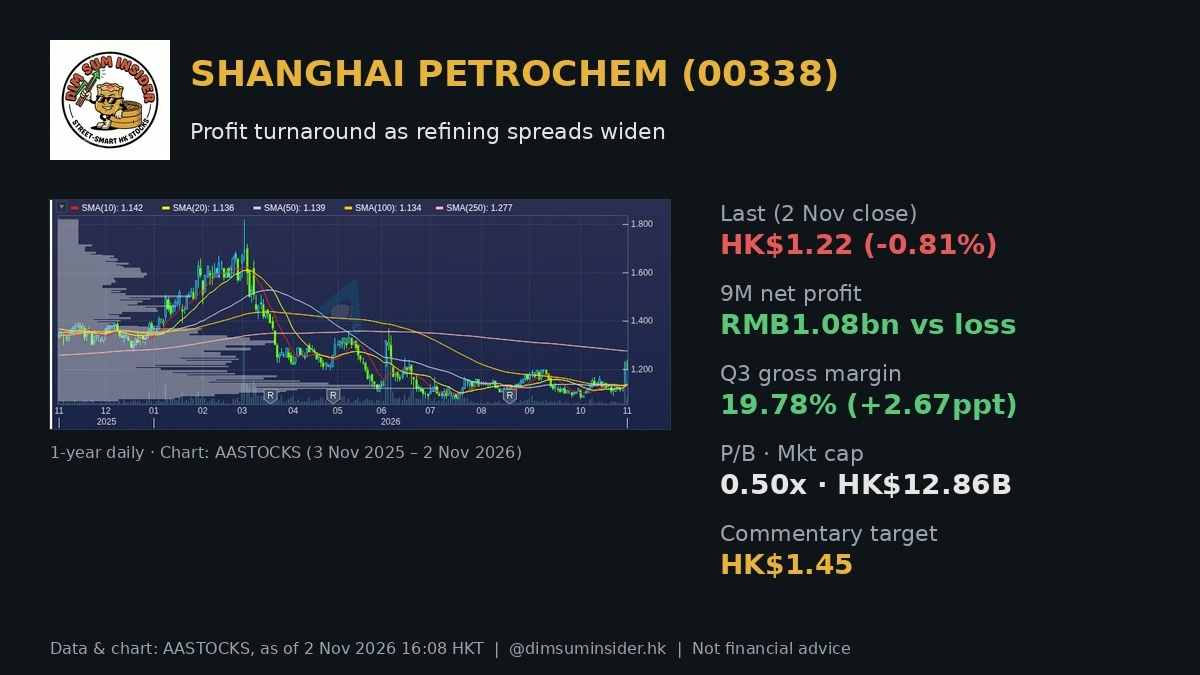
Sinopec Shanghai Petrochemical (00338), listed as SHANGHAI PECHEM on AASTOCKS, jumped 10.3% to HK$1.23 on Friday 30 Oct after its nine-month results, then eased 0.8% to HK$1.22 on Monday 2 Nov. This Shanghai Petrochemical 00338 stock analysis asks one question: is this a real margin recovery or a one-quarter spike? The stock trades at 0.50x book and still shows “No Profit” on a trailing basis, while Q3 profit jumped about 24.6 times year on year.
Market commentary notes see a recovery that is gathering pace. Their view: accumulate near HK$1.20, with a first target of HK$1.45. We think the turnaround is real. How long it lasts depends on refining spreads that are being held up by geopolitics.
Key takeaways
- Back in profit. 9M net profit was RMB 1.08bn, against a loss of RMB 0.43bn a year earlier. Recurring profit was RMB 1.16bn (loss of RMB 0.39bn a year ago).
- Q3 drove it. Q3 revenue rose 7.9% to RMB 20.86bn and profit was RMB 0.78bn, up about 24.6x year on year. That is about 2.6 times H1’s RMB 0.30bn profit.
- Margins widened. Q3 gross margin was 19.78% (+2.67 ppt YoY, +3.92 ppt QoQ). Net margin was 3.63% (+3.47 ppt YoY, +4.26 ppt QoQ).
- Spreads, not volume. Better refining and chemical product spreads did the work, helped by refinery outages linked to geopolitics.
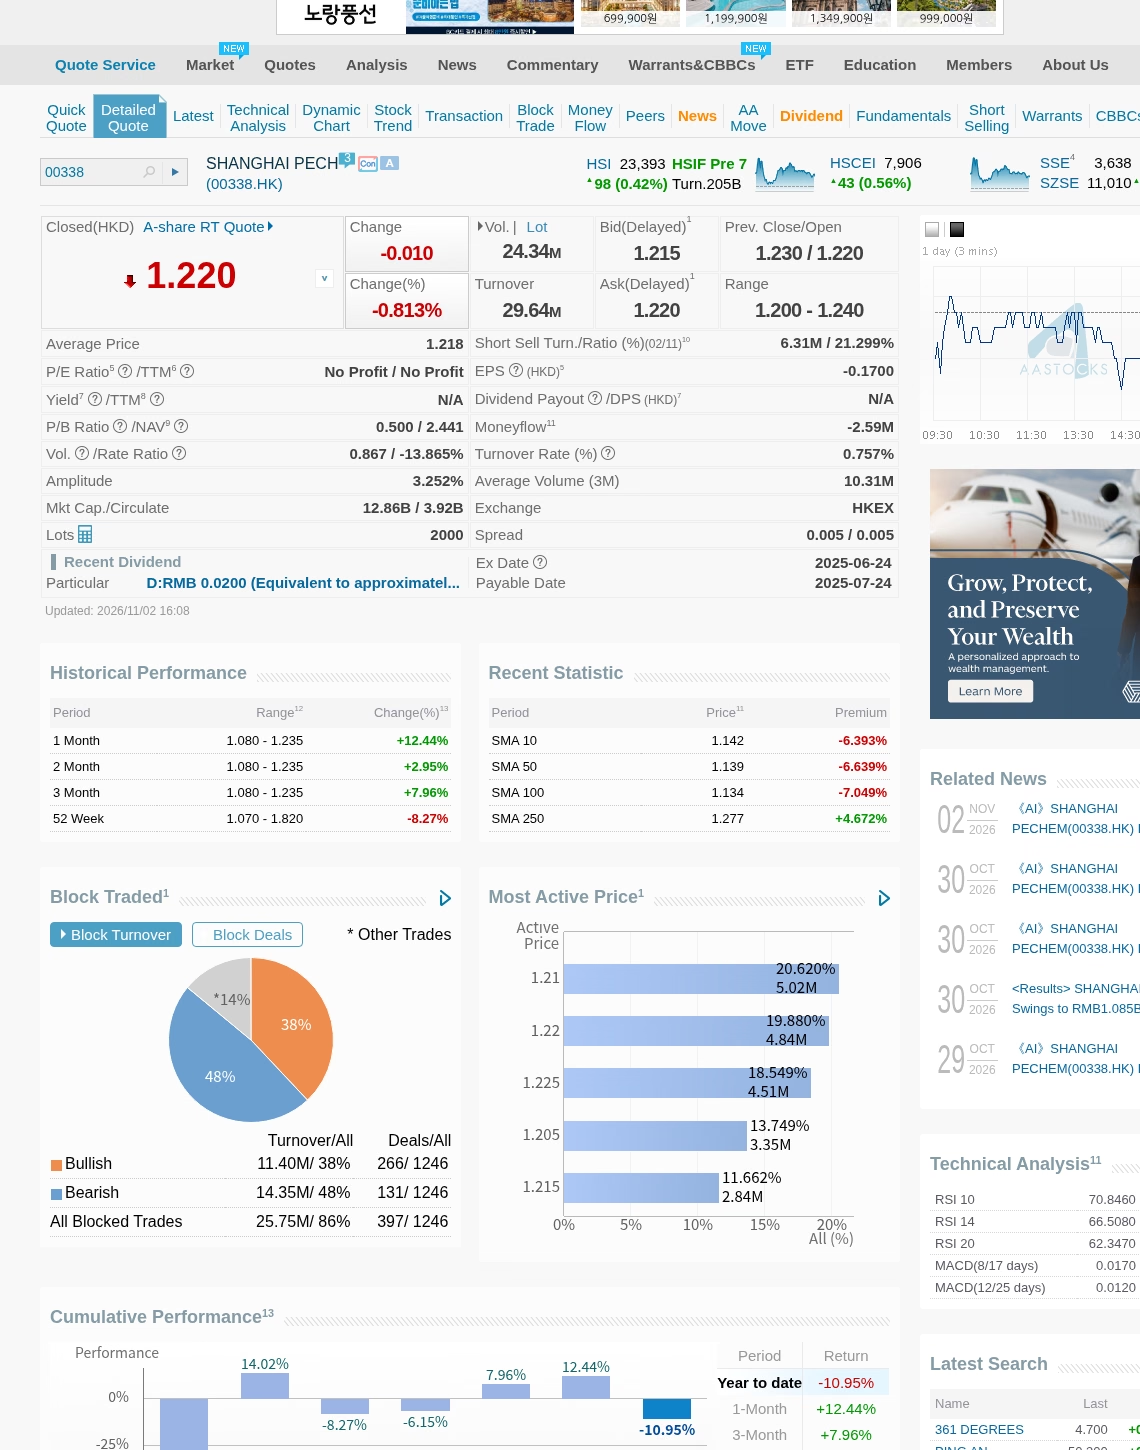
- Cheap on book. AASTOCKS shows P/B 0.50 (NAV HK$2.441) and a market cap of HK$12.86B. Trailing P/E still shows “No Profit”.
- Price action. Friday +10.3% to HK$1.23, Monday −0.8% to HK$1.22. The 52-week range is HK$1.07–1.82.
9M and Q3 results at a glance
| Item | 9M 2026 | Year earlier | Change |
|---|---|---|---|
| Revenue | RMB 59.85bn | — | +1.7% YoY |
| Net profit | RMB 1.08bn | Loss RMB 0.43bn | Turned to profit |
| Recurring net profit | RMB 1.16bn | Loss RMB 0.39bn | Turned to profit |
| Gross margin | 18.71% | — | +1.84 ppt |
| Net margin | 1.74% | — | +2.47 ppt |
| Item | Q3 2026 | Change |
|---|---|---|
| Revenue | RMB 20.86bn | +7.9% YoY |
| Net profit | RMB 0.78bn | ~24.6x YoY; ~2.6x H1 profit |
| Gross margin | 19.78% | +2.67 ppt YoY, +3.92 ppt QoQ |
| Net margin | 3.63% | +3.47 ppt YoY, +4.26 ppt QoQ |
Margin recovery: the quarter that changed the story
H1 was barely profitable: revenue slipped 1.34% and profit was only RMB 0.30bn. Q3 changed that. Revenue grew 7.9%, but profit rose far faster, because the gross margin gained almost 4 ppt in a single quarter. For a refiner this is operating leverage at work. Feedstock is most of the cost base, so a few points of spread drop almost straight to the bottom line.
Commentary notes describe this as the company getting out of its “high cost, low margin” bind. The recurring profit (RMB 1.16bn) is higher than the headline figure, so the improvement is not driven by one-off gains. A 1.74% nine-month net margin is still thin, though. The business stays very sensitive to spreads in both directions.
Refining spreads and geopolitical supply drivers
The main driver is outside the company’s control. According to market commentary notes:
- Refinery damage. The US–Iran conflict and the Russia–Ukraine war have damaged refining facilities. Goldman Sachs estimates refinery outages of about 5.8 million barrels a day (an analyst estimate, not a verified figure).
- Low inventories. Refined product inventories are low, so supply is tight and unlikely to ease in the short term.
- Refining recovers slowly. Analysts note that even if the conflicts ease, refining capacity is likely to recover last. Oilfields can restart once transport resumes, but damaged refineries take a long time to repair. That should keep product prices high in the near to medium term.
For a mainland refiner that is still running, this is a favourable setup: crude is available while product cracks stay wide. The flip side is that the tailwind comes from disruption. A faster-than-expected repair cycle or a ceasefire-driven drop in prices could narrow spreads quickly.
Shanghai Petrochemical 00338 stock analysis: valuation
| Metric | Shanghai Petrochemical (00338) |
|---|---|
| Last price (2026/11/02 close) | HK$1.220 |
| Day change | −HK$0.010 (−0.813%) |
| Prev close / open | HK$1.230 / HK$1.220 |
| Day range | HK$1.200 – 1.240 |
| 52-week range | HK$1.070 – 1.820 |
| Market cap | HK$12.86B |
| P/E / TTM P/E | No Profit / No Profit |
| P/B (NAV HK$2.441) | 0.500x |
| Dividend yield | N/A (last div RMB 0.02, ex 2025-06-24) |
| Volume / turnover | 24.34M / HK$29.64M |
| Commentary checkpoints | Figure |
|---|---|
| Forward P/E | ~10x |
| Dividend | Final dividend expected to resume after profit recovery |
| Entry zone | Accumulate on dips near HK$1.20 |
| First target | HK$1.45 (~19% above HK$1.22) |
What the numbers tell us (our analysis):
- Trailing vs forward. Trailing earnings are still negative (EPS −0.17 on AASTOCKS), so trailing P/E means nothing here. The ~10x forward figure assumes the Q3 run rate holds.
- Book value is the anchor. At 0.50x NAV, the market is still pricing the company as a loss-maker. A sustained return to profit is what would close that gap.
- The dividend is the catalyst. No dividend has been paid on the latest numbers. A resumed final dividend would be a clear signal for income investors.
Technical analysis: breaking out of the base
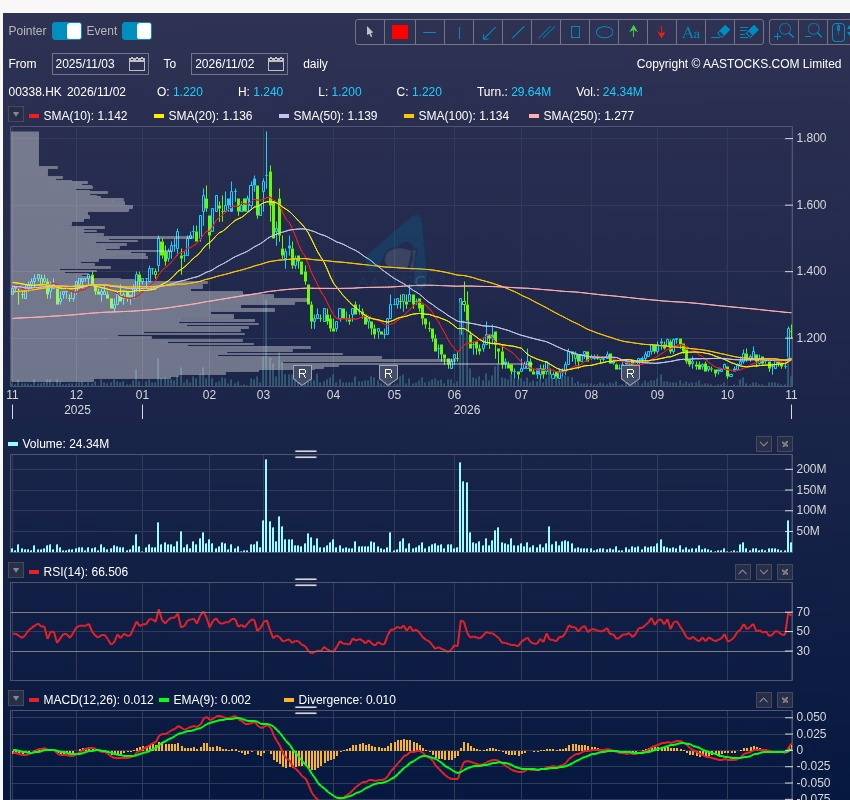
The AASTOCKS one-year daily chart (3 Nov 2025 to 2 Nov 2026) shows a run to about HK$1.82 in March and a slide to a two-year low near HK$1.07. Since around July the stock has traded in a HK$1.07–1.20 box. Friday’s jump took it to the top of that box, and it held most of the gain on Monday.
- Moving averages. The price of 1.22 is above SMA10 1.142, SMA20 1.136, SMA50 1.139 and SMA100 1.134, which are all bunched together. It is still below SMA250 1.277.
- Momentum. RSI(14) is 66.5, close to overbought (RSI10 is 70.8). MACD(12,26) is 0.012 against a signal of 0.002, so the crossover is bullish.
- Support. HK$1.20 (top of the box and the Monday low), then HK$1.13–1.14 (the SMA cluster), then HK$1.07.
- Resistance. HK$1.24 (Monday high), then HK$1.277 (SMA250), then the commentary’s HK$1.45 target.
Risks
- Spread reversal. If geopolitical tension eases or repaired refineries come back faster than expected, crack spreads could compress quickly.
- Crude cost spikes. A sharp rise in crude without matching product prices would squeeze margins again.
- Thin margins. A 1.74% nine-month net margin leaves little buffer.
- Policy and pricing. Mainland fuel pricing and the policy environment can cap how much of the spread is captured.
- Technical risk. RSI is near overbought after a 10% day, and the stock is still below SMA250. A drop back into the box would weaken the breakout.
- Dividend uncertainty. A resumed final dividend is an expectation, not an announcement.
The DimSumInsider take
Shanghai Petrochemical’s Q3 shows how quickly a refiner’s earnings can turn when spreads move. Profit rose about 24.6x, gross margin gained nearly 4 ppt in a quarter, and recurring profit is ahead of the headline number. At 0.50x book, the market is not yet paying for the recovery. Our approach is in line with the commentary: build positions near HK$1.20, look for a close above SMA250 (HK$1.277) as confirmation, and treat HK$1.45 as the first target. Cut if the price falls back below the HK$1.13 moving-average cluster. Keep watching refining spreads. They drove the turnaround, and they are also the main risk.
FAQ
What were Shanghai Petrochemical’s 9M 2026 results?
Revenue was RMB 59.85bn (+1.7% YoY). Net profit was RMB 1.08bn, against a loss of RMB 0.43bn a year earlier. Recurring profit was RMB 1.16bn. Gross margin was 18.71% and net margin 1.74%.
Why did 00338 jump 10.3%?
The nine-month results released on Friday showed Q3 profit of RMB 0.78bn, up about 24.6x year on year. The shares rose 10.3% to HK$1.23, then fell 0.8% to HK$1.22 on Monday.
What is Shanghai Petrochemical’s valuation?
According to AASTOCKS as of 2026/11/02 close: HK$1.22, P/B 0.50, market cap HK$12.86B, and a trailing P/E of “No Profit”. Market commentary notes put the forward P/E at about 10x.
What levels matter for 00338?
Support is at HK$1.20, then HK$1.13–1.14, then HK$1.07. Resistance is at HK$1.24, then HK$1.277 (SMA250), then HK$1.45.
Disclaimer: For information only. Based on public market commentary notes, company results as reported, and AASTOCKS data as of 2026/11/02 16:08 HKT (market Closed); data may be delayed. The refinery-outage figure is a third-party analyst estimate, and forward figures are estimates. DimSumInsider may hold positions not stated here. Consult a licensed financial adviser. This is not financial advice. Do your own research.